OPEN-SOURCE SCRIPT
已更新 Previous Day Fibonacci + Opening Range
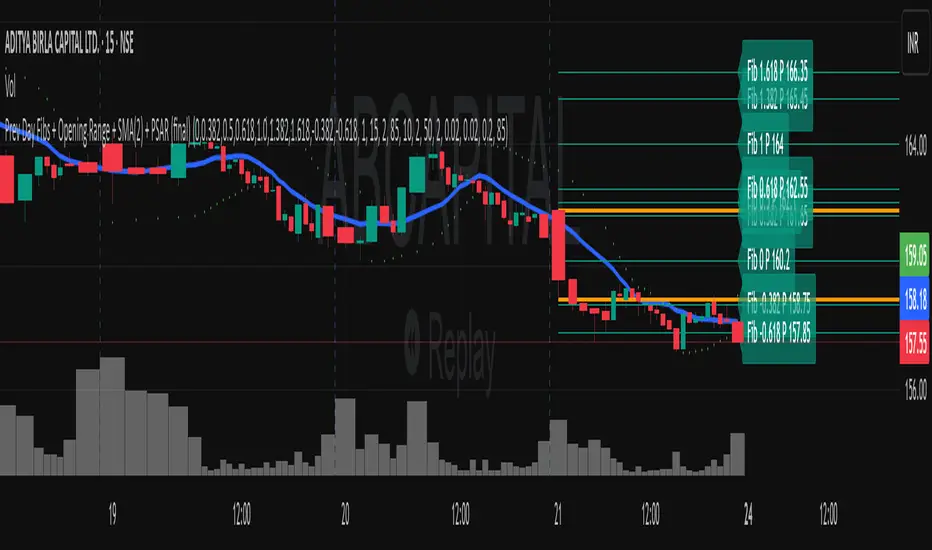
Prev Day Fibonacci & Opening Range Levels
This indicator is designed for professional traders who want to combine yesterday’s market structure with today’s intraday levels.
🔹 Features:
Automatic Fibonacci Retracements: Draws customizable Fibonacci retracement/extension levels based on the previous day’s High & Low.
Full Customization: Users can adjust the Fibonacci ratios and colors directly in settings.
Opening Range Levels: Plots today’s first candle High & Low (user-selectable timeframe for OR).
Clear Visuals: Helps identify key reversal zones, breakout levels, and confluence areas between higher timeframe structure and intraday moves.
🔹 Usage Ideas:
Spot potential reversal zones when price reacts to previous-day Fib levels.
Combine Opening Range breakout strategies with daily Fib levels for high-probability setups.
Use as confluence levels with your existing price action or indicator-based strategy.
⚡ Pro Tip: Look for overlaps between the Opening Range and Fibonacci retracements — these zones often act as strong support/resistance areas.
發行說明
This custom indicator combines multiple technical analysis tools into one comprehensive package to assist traders with market structure, trend direction, and potential reversal zones.🔹 Features Included:
Simple Moving Averages (SMA): Useful for spotting trend direction and crossovers.
Parabolic SAR: Highlights trailing stop levels and potential trend reversals.
Custom Fibonacci Levels: Automatically plotted with price and percentage labels for dynamic support/resistance mapping.
Opening Range Levels: Automatically plotted Opening Range
🔹 Key Benefits:
All-in-One Tool: No need to load multiple indicators separately.
Visual-Only Overlay: Cleanly displays signals without cluttering the chart.
Adjustable Settings: Users can customize indicator values, line colors, and enable/disable components.
Dynamic Fibonacci Labels: Show both % retracement and precise price with optional decimal formatting.
Works on all timeframes and instruments (stocks, crypto, forex, indices).
⚠️ Disclaimer: This script is for educational purposes only. It is not financial advice. Always backtest thoroughly and use risk management before applying to live trading.
開源腳本
秉持TradingView一貫精神,這個腳本的創作者將其設為開源,以便交易者檢視並驗證其功能。向作者致敬!您可以免費使用此腳本,但請注意,重新發佈代碼需遵守我們的社群規範。
免責聲明
這些資訊和出版物並非旨在提供,也不構成TradingView提供或認可的任何形式的財務、投資、交易或其他類型的建議或推薦。請閱讀使用條款以了解更多資訊。
開源腳本
秉持TradingView一貫精神,這個腳本的創作者將其設為開源,以便交易者檢視並驗證其功能。向作者致敬!您可以免費使用此腳本,但請注意,重新發佈代碼需遵守我們的社群規範。
免責聲明
這些資訊和出版物並非旨在提供,也不構成TradingView提供或認可的任何形式的財務、投資、交易或其他類型的建議或推薦。請閱讀使用條款以了解更多資訊。