OPEN-SOURCE SCRIPT
Support and Resistance Levels
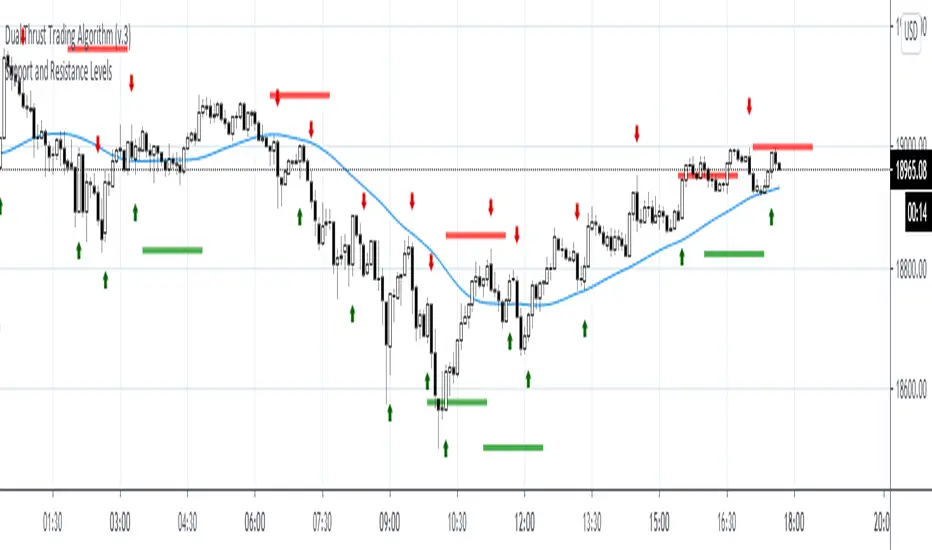
Detecting Support and Resistance Levels
Description:
Support & Resistance levels are essential for every trader to define the decision points of the markets. If you are long and the market falls below the previous support level, you most probably have got the wrong position and better exit.
This script uses the first and second deviation of a curve to find the turning points and extremes of the price curve.
The deviation of a curve is nothing else than the momentum of a curve (and inertia is another name for momentum). It defines the slope of the curve. If the slope of a curve is zero, you have found a local extreme. The curve will change from rising to falling or the other way round.
The second deviation, or the momentum of momentum, shows you the turning points of the first deviation. This is important, as at this point the original curve will switch from acceleration to break mode.
Using the logic laid out above the support&resistance indicator will show the turning points of the market in a timely manner. Depending on level of market-smoothing it will show the long term or short term turning points.
This script first calculates the first and second deviation of the smoothed market, and in a second step runs the turning point detection.
Style tags: Trend Following, Trend Analysis
Asset class: Equities, Futures, ETFs, Currencies and Commodities
Dataset: FX Minutes/Hours/Days
開源腳本
秉持TradingView一貫精神,這個腳本的創作者將其設為開源,以便交易者檢視並驗證其功能。向作者致敬!您可以免費使用此腳本,但請注意,重新發佈代碼需遵守我們的社群規範。
免責聲明
這些資訊和出版物並非旨在提供,也不構成TradingView提供或認可的任何形式的財務、投資、交易或其他類型的建議或推薦。請閱讀使用條款以了解更多資訊。
免責聲明
這些資訊和出版物並非旨在提供,也不構成TradingView提供或認可的任何形式的財務、投資、交易或其他類型的建議或推薦。請閱讀使用條款以了解更多資訊。