INVITE-ONLY SCRIPT
已更新 Market Volatility Momentum + Trend Filter Pro @MaxMaserati
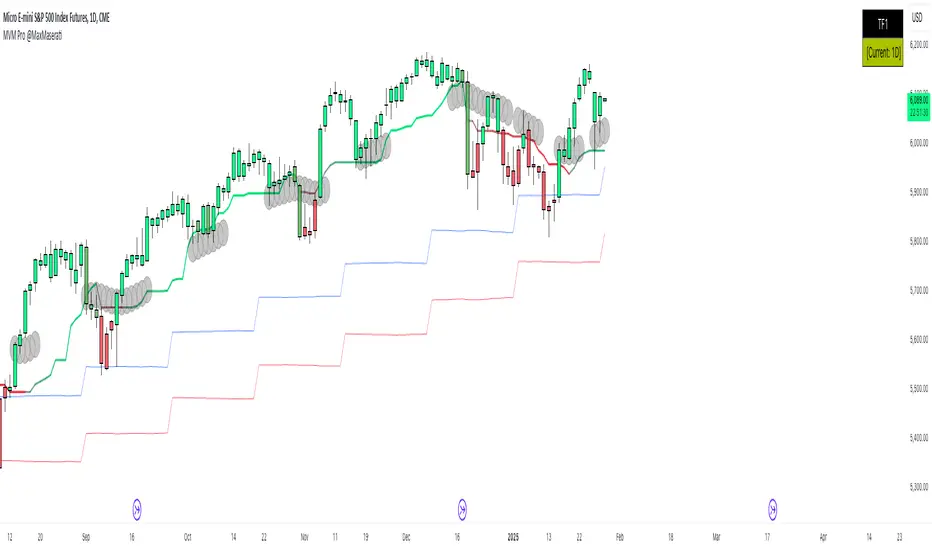
# 📊 Market Volatility Momentum + Trend Filter Pro
## 🎯 Overview
An enhanced version of the Market Momentum Indicator, combining the power of momentum analysis with adaptive volatility bands and trend filtering. This professional tool helps traders identify market direction and potential momentum shifts with greater precision.
## 🔄 Core Momentum Components
### 📈 Momentum Line
- Calculated using the midpoint between highest and lowest prices over 14 periods
- Provides a clear reference for price direction
- Acts as a dynamic support/resistance level
### 📉 Momentum Signal
- Offset from the Momentum Line by 0.25 tick size
- Creates a precise visual guide for momentum shifts
- Standard increment compatible with most markets

## 💫 Enhanced Features
### 🌊 Trend Filter
- Dynamic color-coding system showing trend strength
- Customizable length and damping parameters
- Visual identification of neutral market conditions
### 📊 Volatility Bands
- Adaptive bands that expand and contract with market volatility
- Choice between short-term and long-term trend adaptation
- Provides additional confirmation of trend strength
## 📝 Trading Signals
### 📈 Bullish Momentum
- Both momentum lines below price
- Enhanced by trend filter color confirmation
- Supported by volatility band positioning
### 📉 Bearish Momentum
- Both momentum lines above price
- Confirmed by trend filter color signals
- Reinforced by volatility band context
### ⚖️ Consolidation
- Momentum lines within price range
- Neutral trend indication with deep blue area
- Potential breakout preparation phase
## ⚙️ Multi-Timeframe Analysis
- Dual timeframe capability for comprehensive market view
- Custom timeframe selection with current chart reference
- Real-time timeframe display in top-right corner
## 🎨 Visual Features
- Dynamic bar coloring system reflecting trend strength
- Clear trend visualization through color gradients
- Optional line smoothing for reduced noise
- Customizable color schemes
## 💡 Tips for Usage
1. Monitor the position of price relative to momentum lines
2. Use trend filter colors for confirmation
3. Watch for convergence with volatility bands
4. Pay attention to neutral market signals
5. Utilize multi-timeframe analysis for better context
## ⚠️ Important Notes
- Originally designed without smoothing (smoothing optional)
- Best used with multiple timeframe analysis
- Provides clearest signals in trending markets
- Works effectively across all tradable assets
Note: Past performance doesn't guarantee future results. Always practice proper risk management and develop your trading plan.
## 🎯 Overview
An enhanced version of the Market Momentum Indicator, combining the power of momentum analysis with adaptive volatility bands and trend filtering. This professional tool helps traders identify market direction and potential momentum shifts with greater precision.
## 🔄 Core Momentum Components
### 📈 Momentum Line
- Calculated using the midpoint between highest and lowest prices over 14 periods
- Provides a clear reference for price direction
- Acts as a dynamic support/resistance level
### 📉 Momentum Signal
- Offset from the Momentum Line by 0.25 tick size
- Creates a precise visual guide for momentum shifts
- Standard increment compatible with most markets
## 💫 Enhanced Features
### 🌊 Trend Filter
- Dynamic color-coding system showing trend strength
- Customizable length and damping parameters
- Visual identification of neutral market conditions
### 📊 Volatility Bands
- Adaptive bands that expand and contract with market volatility
- Choice between short-term and long-term trend adaptation
- Provides additional confirmation of trend strength
## 📝 Trading Signals
### 📈 Bullish Momentum
- Both momentum lines below price
- Enhanced by trend filter color confirmation
- Supported by volatility band positioning
### 📉 Bearish Momentum
- Both momentum lines above price
- Confirmed by trend filter color signals
- Reinforced by volatility band context
### ⚖️ Consolidation
- Momentum lines within price range
- Neutral trend indication with deep blue area
- Potential breakout preparation phase
## ⚙️ Multi-Timeframe Analysis
- Dual timeframe capability for comprehensive market view
- Custom timeframe selection with current chart reference
- Real-time timeframe display in top-right corner
## 🎨 Visual Features
- Dynamic bar coloring system reflecting trend strength
- Clear trend visualization through color gradients
- Optional line smoothing for reduced noise
- Customizable color schemes
## 💡 Tips for Usage
1. Monitor the position of price relative to momentum lines
2. Use trend filter colors for confirmation
3. Watch for convergence with volatility bands
4. Pay attention to neutral market signals
5. Utilize multi-timeframe analysis for better context
## ⚠️ Important Notes
- Originally designed without smoothing (smoothing optional)
- Best used with multiple timeframe analysis
- Provides clearest signals in trending markets
- Works effectively across all tradable assets
Note: Past performance doesn't guarantee future results. Always practice proper risk management and develop your trading plan.
發行說明
- Bugs fix僅限邀請腳本
只有經作者授權的使用者才能訪問此腳本,且通常需付費。您可以將此腳本加入收藏,但需先向作者申請並獲得許可後才能使用 — 點擊此處了解更多。如需更多詳情,請依照作者說明或直接聯繫MaxMaserati。
除非您完全信任其作者並了解腳本的工作原理,否則TradingView不建議您付費或使用腳本。您也可以在我們的社群腳本中找到免費的開源替代方案。
作者的說明
Access: https://whop.com/max-maserati/
提醒:在請求訪問權限之前,請閱讀僅限邀請腳本指南。
MMM : No body close (PO4), No Trade.
免責聲明
這些資訊和出版物並不意味著也不構成TradingView提供或認可的金融、投資、交易或其他類型的意見或建議。請在使用條款閱讀更多資訊。
僅限邀請腳本
只有經作者授權的使用者才能訪問此腳本,且通常需付費。您可以將此腳本加入收藏,但需先向作者申請並獲得許可後才能使用 — 點擊此處了解更多。如需更多詳情,請依照作者說明或直接聯繫MaxMaserati。
除非您完全信任其作者並了解腳本的工作原理,否則TradingView不建議您付費或使用腳本。您也可以在我們的社群腳本中找到免費的開源替代方案。
作者的說明
Access: https://whop.com/max-maserati/
提醒:在請求訪問權限之前,請閱讀僅限邀請腳本指南。
MMM : No body close (PO4), No Trade.
免責聲明
這些資訊和出版物並不意味著也不構成TradingView提供或認可的金融、投資、交易或其他類型的意見或建議。請在使用條款閱讀更多資訊。