OPEN-SOURCE SCRIPT
已更新 Smooth Fibonacci Bands
Smooth Fibonacci Bands
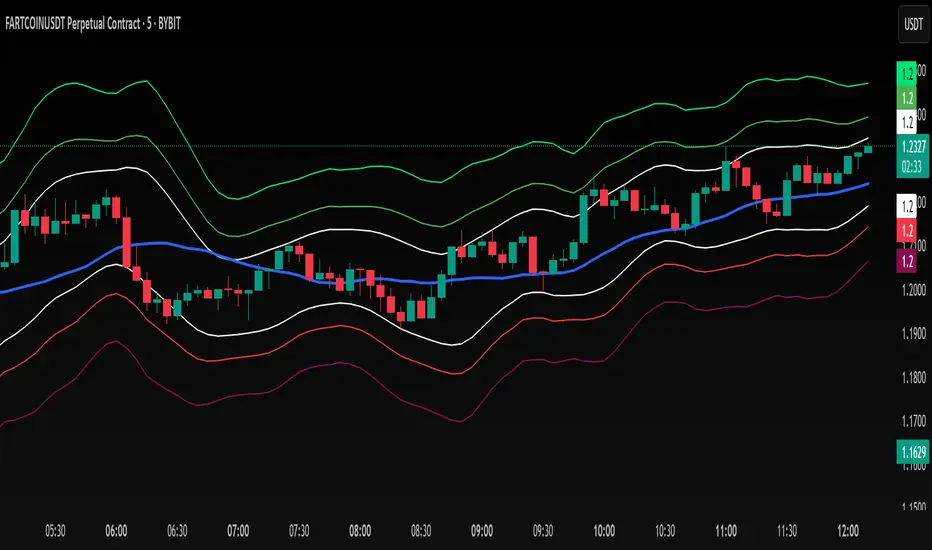
This indicator overlays adaptive Fibonacci bands on your chart, creating dynamic support and resistance zones based on price volatility. It combines a simple moving average with ATR-based Fibonacci levels to generate multiple bands that expand and contract with market conditions.
## Features
- Creates three pairs of upper and lower Fibonacci bands
- Smoothing option for cleaner, less noisy bands
- Fully customizable colors and line thickness
- Adapts automatically to changing market volatility
## Settings
Adjust the SMA and ATR lengths to match your trading timeframe. For short-term trading, try lower values; for longer-term analysis, use higher values. The Fibonacci factors determine how far each band extends from the center line - standard Fibonacci ratios (1.618, 2.618, and 4.236) are provided as defaults.
## Trading Applications
- Use band crossovers as potential entry and exit signals
- Look for price bouncing off bands as reversal opportunities
- Watch for price breaking through multiple bands as strong trend confirmation
- Identify potential support/resistance zones for placing stop losses or take profits
Fibonacci Bands combines the reliability of moving averages with the adaptability of ATR and the natural market harmony of Fibonacci ratios, offering a robust framework for both trend and range analysis.
發行說明
Added Alerts FunctionalityThe indicator provides alerts for price crossovers of each band:
Middle line (SMA) crossovers
Upper and lower band crossings for all three Fibonacci levels
Customizable alert settings to focus only on bands you're trading
Trading Applications
Use band crossovers as potential entry and exit signals (with automatic alerts)
Look for price bouncing off bands as reversal opportunities
Watch for price breaking through multiple bands as strong trend confirmation
Identify potential support/resistance zones for placing stop losses or take profits
發行說明
Changed the default Lengths from 50, 14, and 5 to 8,6 and 3 for optimizing the 5 min time frame開源腳本
秉持TradingView一貫精神,這個腳本的創作者將其設為開源,以便交易者檢視並驗證其功能。向作者致敬!您可以免費使用此腳本,但請注意,重新發佈代碼需遵守我們的社群規範。
免責聲明
這些資訊和出版物並非旨在提供,也不構成TradingView提供或認可的任何形式的財務、投資、交易或其他類型的建議或推薦。請閱讀使用條款以了解更多資訊。
開源腳本
秉持TradingView一貫精神,這個腳本的創作者將其設為開源,以便交易者檢視並驗證其功能。向作者致敬!您可以免費使用此腳本,但請注意,重新發佈代碼需遵守我們的社群規範。
免責聲明
這些資訊和出版物並非旨在提供,也不構成TradingView提供或認可的任何形式的財務、投資、交易或其他類型的建議或推薦。請閱讀使用條款以了解更多資訊。