OPEN-SOURCE SCRIPT
已更新 Support/Resistance v2 (ML) Kmean
Kmean with Standard Deviation Channel
1. Description of Kmean
Kmean (or K-means) is a popular clustering algorithm used to divide data into K groups based on their similarity. In the context of financial markets, Kmean can be applied to find the average price values over a specific period, allowing the identification of major trends and levels of support and resistance.
2. Application in Trading
In trading, Kmean is used to smooth out the price series and determine long-term trends. This helps traders make more informed decisions by avoiding noise and short-term fluctuations. Kmean can serve as a baseline around which other analytical tools, such as channels and bands, are constructed.
3. Description of Standard Deviation (stdev)
Standard deviation (stdev) is a statistical measure that indicates how much the values of data deviate from their mean value. In finance, standard deviation is often used to assess price volatility. A high standard deviation indicates strong price fluctuations, while a low standard deviation indicates stable movements.
4. Combining Kmean and Standard Deviation to Predict Short-Term Price Behavior
Combining Kmean and standard deviation creates a powerful tool for analyzing market conditions. Kmean shows the average price trend, while the standard deviation channels demonstrate the boundaries within which the price can fluctuate. This combination helps traders to:
Should you have any questions about code, please reach me at Tradingview directly.
Hope you find this script helpful!
1. Description of Kmean
Kmean (or K-means) is a popular clustering algorithm used to divide data into K groups based on their similarity. In the context of financial markets, Kmean can be applied to find the average price values over a specific period, allowing the identification of major trends and levels of support and resistance.
2. Application in Trading
In trading, Kmean is used to smooth out the price series and determine long-term trends. This helps traders make more informed decisions by avoiding noise and short-term fluctuations. Kmean can serve as a baseline around which other analytical tools, such as channels and bands, are constructed.
3. Description of Standard Deviation (stdev)
Standard deviation (stdev) is a statistical measure that indicates how much the values of data deviate from their mean value. In finance, standard deviation is often used to assess price volatility. A high standard deviation indicates strong price fluctuations, while a low standard deviation indicates stable movements.
4. Combining Kmean and Standard Deviation to Predict Short-Term Price Behavior
Combining Kmean and standard deviation creates a powerful tool for analyzing market conditions. Kmean shows the average price trend, while the standard deviation channels demonstrate the boundaries within which the price can fluctuate. This combination helps traders to:
- Identify support and resistance levels.
- Predict potential price reversals.
- Assess risks and set stop-losses and take-profits.
Should you have any questions about code, please reach me at Tradingview directly.
Hope you find this script helpful!
發行說明
Kmean with Standard Deviation Channel1. Description of Kmean
Kmean (or K-means) is a popular clustering algorithm used to divide data into K groups based on their similarity. In the context of financial markets, Kmean can be applied to find the average price values over a specific period, allowing the identification of major trends and levels of support and resistance.
2. Application in Trading
In trading, Kmean is used to smooth out the price series and determine long-term trends. This helps traders make more informed decisions by avoiding noise and short-term fluctuations. Kmean can serve as a baseline around which other analytical tools, such as channels and bands, are constructed.
3. Description of Standard Deviation (stdev)
Standard deviation (stdev) is a statistical measure that indicates how much the values of data deviate from their mean value. In finance, standard deviation is often used to assess price volatility. A high standard deviation indicates strong price fluctuations, while a low standard deviation indicates stable movements.
4. Combining Kmean and Standard Deviation to Predict Short-Term Price Behavior
Combining Kmean and standard deviation creates a powerful tool for analyzing market conditions. Kmean shows the average price trend, while the standard deviation channels demonstrate the boundaries within which the price can fluctuate. This combination helps traders to:
Identify support and resistance levels.
Predict potential price reversals.
Assess risks and set stop-losses and take-profits.
Should you have any questions about code, please reach me at Tradingview directly.
Hope you find this script helpful!
發行說明
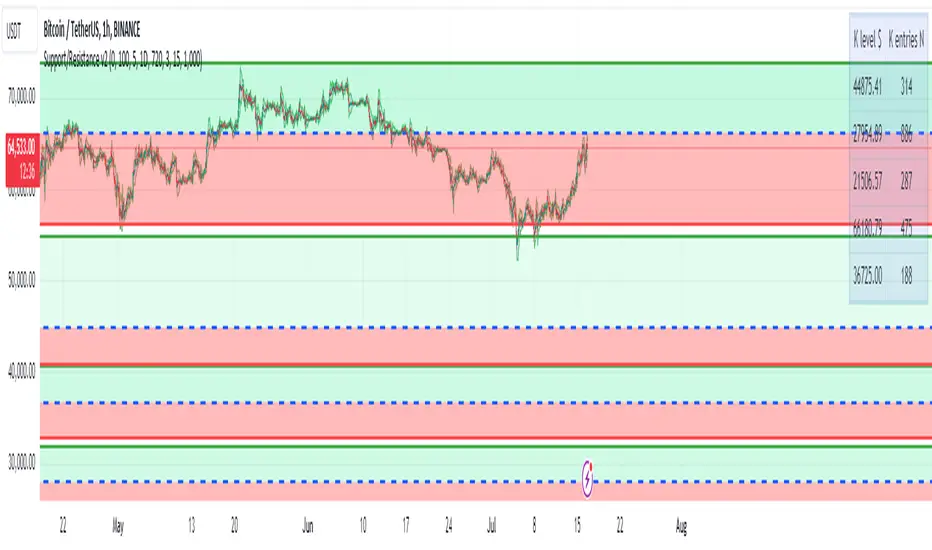
Additional description:In this case, we are looking for strong clusters where the midpoint is near the upper or lower point of the cluster. The colors are represented by a gradient and become more transparent as the midpoint moves farther from the upper or lower point.
Using shifted standard deviation (STDEV), we can determine when the price may touch the value that lies between two clusters or the midpoint, enabling us to trade channels or reversal patterns.
開源腳本
秉持TradingView一貫精神,這個腳本的創作者將其設為開源,以便交易者檢視並驗證其功能。向作者致敬!您可以免費使用此腳本,但請注意,重新發佈代碼需遵守我們的社群規範。
免責聲明
這些資訊和出版物並非旨在提供,也不構成TradingView提供或認可的任何形式的財務、投資、交易或其他類型的建議或推薦。請閱讀使用條款以了解更多資訊。
免責聲明
這些資訊和出版物並非旨在提供,也不構成TradingView提供或認可的任何形式的財務、投資、交易或其他類型的建議或推薦。請閱讀使用條款以了解更多資訊。