INVITE-ONLY SCRIPT
Z-Phantom Wave | Oquant
Overview
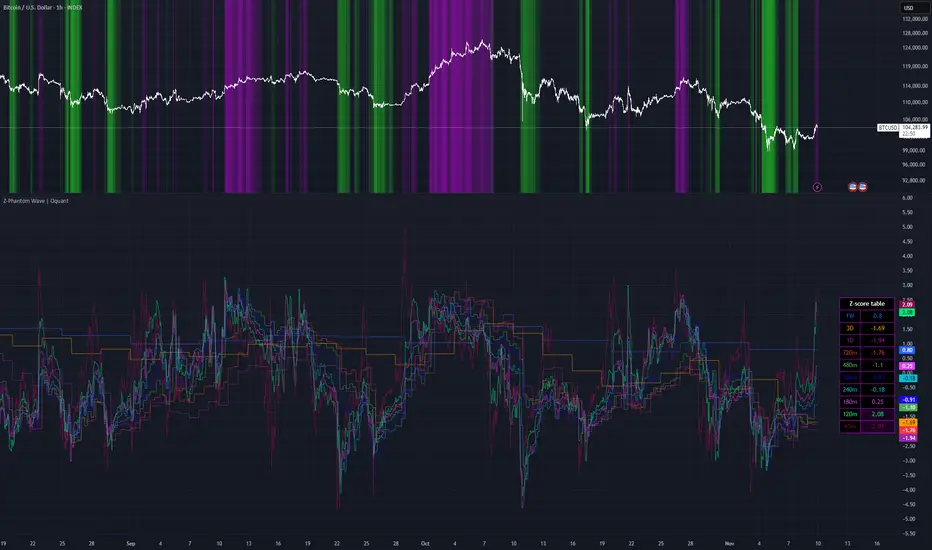
The Z-Phantom Wave indicator is a flexible multi-timeframe tool. It helps traders spot possible overbought and oversold areas across different timeframes. It uses Z-scores, which measure how much prices deviate from their average, to show market extremes in charts and a table. This lets users see if signals match up or differ, helping with timing buys, sells, or reversals. It includes wavy line plots, color highlights for extreme zones, and a warning if timeframes doesn’t match the lowest selected timeframe.
Key Factors/Components
Multi-Timeframe Analysis: Handles up to 10 user-chosen timeframes (like weekly to hourly) for a layered view of the market.
Z-Score Calculation: Main measure based on price deviations from a mean, with options for sources (e.g., close price, SMA, EMA) and lengths.
Threshold Detection: Adjustable levels for overbought and oversold to mark extremes, with colors and backgrounds for easy spotting.
Table Display: A simple table listing Z-scores per timeframe, with colors for quick checks.
Plotting and Backgrounds: Lines for each timeframe's Z-score, plus optional background colors to highlight overbought/oversold areas.
Timeframe Warning: Alerts if the chart's timeframe is higher than the lowest selected timeframe, to keep readings accurate.
Color Scheme: Unique colors for each timeframe's line and table, with purple for overbought and green for oversold.
How It Works
The tool pulls data from your chosen source and turns it into Z-scores across multiple timeframes at once. These scores show how far values are from mean, pointing out potential overbought/oversold areas. The basic idea is to compare deviations on different scales: when several timeframes line up in extreme zones (like all oversold), it suggests a stronger chance of a turnaround. When multiple timeframes show oversold or overbought, the background color function layers these signals, making the oversold or overbought color stronger and more noticeable. Background shades cover the chart to mark these zones visually, and the table gives a fast overview.
For Who Is Best/Recommended Use Cases
This indicator is best suited for mean-reversion traders, swing traders, or those incorporating multi-timeframe analysis into their strategies. It is particularly useful in ranging markets. For example, scalpers might focus on lower timeframes for quick signals, while position traders could prioritize higher ones for broader context.
Settings and Default Settings
Z-score Source (Default: "close"): Selects the base input for z-score calculations, such as open, high, low, close, or moving averages like SMA or EMA.
Z-score Length (Default: 60): The period used to calculate the mean and standard deviation for the Z-score.
Moving Average Source (Default: close): The data source for any moving average selected in Z-score Source.
MA Length (Default: 25): The length for the chosen moving average type.
Overbought Threshold (Default: 2.0): The upper Z-score level triggering purple highlights.
Oversold Threshold (Default: -2.0): The lower Z-score level triggering green highlights.
Plot Background on OB/OS Zones (Default: True): Enables/disables chart background coloring for overbought/oversold zones.
Timeframe 1 to 10 (Defaults: 1W, 3D, 1D, 12h, 8h, 6h, 4h, 3h, 2h, 1h): User-selectable timeframes for Z-score calculations; ensure the chart timeframe is at or below the smallest selected timeframe.
Conclusion
The Z-Phantom Wave offers a straightforward tool for integrating statistical insights across multiple timeframes, helping traders make more informed decisions by highlighting price deviations. Its table-based presentation simplifies reading the z-scores, making it accessible for various experience levels.
⚠️ Disclaimer: This indicator is intended for educational and informational purposes only. Trading/investing involves risk, and past performance does not guarantee future results. Always test and evaluate indicators/strategies before applying them in live markets. Use at your own risk.
僅限邀請腳本
只有經作者批准的使用者才能訪問此腳本。您需要申請並獲得使用權限。該權限通常在付款後授予。如欲了解更多詳情,請依照以下作者的說明操作,或直接聯絡oquant。
除非您完全信任其作者並了解腳本的工作原理,否則TradingView不建議您付費或使用腳本。您也可以在我們的社群腳本中找到免費的開源替代方案。
作者的說明
Check my website for access.
https://oquantsystems.com
Get access to Oquant's premium tools.
oquantsystems.com
oquantsystems.com
免責聲明
這些資訊和出版物並不意味著也不構成TradingView提供或認可的金融、投資、交易或其他類型的意見或建議。請在使用條款閱讀更多資訊。