OPEN-SOURCE SCRIPT
已更新 Fibonacci Ghost Cloud
Hello my nocturnal minions.... This is your dark knight in the crypto light.... your alpha and omega, your crypto king reigning wisdom down from my gilded throne of code!
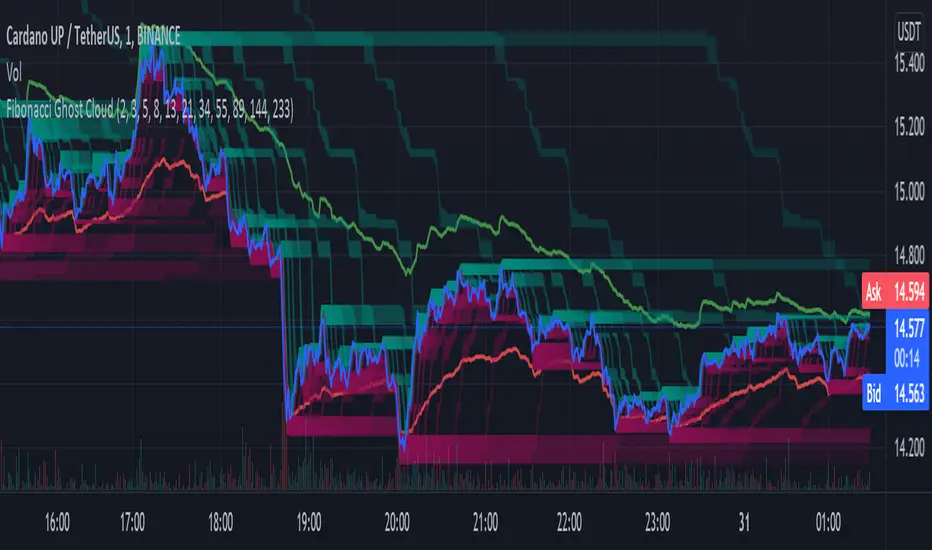
Enjoy the spooky Fibonacci Ghost Cloud. Shadows of previous Fibonacci look-back levels provide possible entries, stop losses, and take profit levels for intrepid crypto travelers.
DESCRIPTION
This indicator is front weighted by using the Fibonacci integer sequence..... 2,3,5,8,13. Each green and red "ghost" is a reflection of the highest highs and lowest lows of a given FIB lookback. The guide lines, red and green, are averages of the highs (green) and the lows (red).
USAGE
The "ghosts" can be used as possible support and resistance levels. They diminish in intensity (they become more transparent) as these ghosts move back further in time. When multiple greens overlap it is an indicator of a lot of recent price action at that level. The same is true of overlapping red.
In addition, the amount of ghosts above and/or below are indicative of recent price action taking place at a higher or a lower level
CURRENT PRICE IS LOWER THAN RECENT PA - There will be many green ghosts above, but few or no red ghosts below.
CURRENT PRICE IS HIGHER THAN RECENT PA- There will be many red ghosts below, but few or no green above
TAKE PROFIT - Possible take profit targets could be on the approach to a previous green level
STOP LOSS - Possible stop losses could be at lower red level
Like Bollinger bands, the green and red "average" lines can help to indicate that a security is oversold or underbought according to how close it is to a recent average. Nearing the red line can indicate that the security is oversold - and the converse is also true.
DERIVATIONS
Within the code is additional greyed-out lines which could be activated allowing you to target the open or close, instead of the High-Low - the current settings
SETTINGS:
You can change the FIB levels and substitute your own integer sequence to use as the lookback.
Feel free to offer feedback and/or suggest features you would like to have added.
發行說明
Repairing a small labeling problem that I overlooked in V1開源腳本
秉持TradingView一貫精神,這個腳本的創作者將其設為開源,以便交易者檢視並驗證其功能。向作者致敬!您可以免費使用此腳本,但請注意,重新發佈代碼需遵守我們的社群規範。
免責聲明
這些資訊和出版物並非旨在提供,也不構成TradingView提供或認可的任何形式的財務、投資、交易或其他類型的建議或推薦。請閱讀使用條款以了解更多資訊。
開源腳本
秉持TradingView一貫精神,這個腳本的創作者將其設為開源,以便交易者檢視並驗證其功能。向作者致敬!您可以免費使用此腳本,但請注意,重新發佈代碼需遵守我們的社群規範。
免責聲明
這些資訊和出版物並非旨在提供,也不構成TradingView提供或認可的任何形式的財務、投資、交易或其他類型的建議或推薦。請閱讀使用條款以了解更多資訊。