INVITE-ONLY SCRIPT
Time Trades
已更新
These indicators are part of the Time Trades service.
This script includes 2 timing indicators:
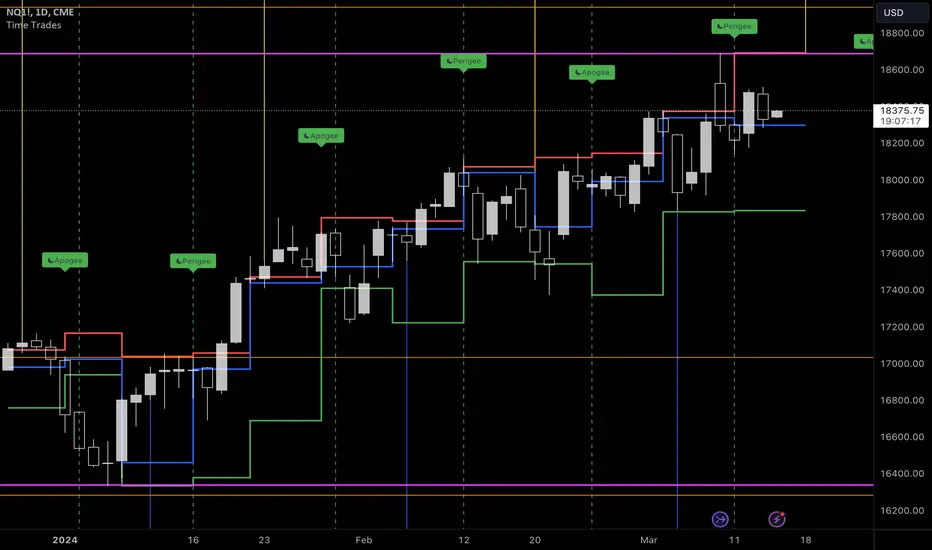
* Cheat Code displays green and purple timing periods
* Gann Waves displays yellow and blue vertical bars
Both indicators are based on natural cycles, and are visible into the future.
Visibility of both indicators is controlled via the Settings menu.
Cheat Code:
* Displays green periods and purple periods.
* Prices seem to trend more within a green period, both up and down.
* Often there’s major pivots around the middle of a green period, and about 3/4 through.
* Prices seem to chop more within a purple period with lots of volatility and reversals.
* Thin light grey lines appear at regular intervals that tend to align with local pivots.
* Thick grey lines appear around the middle of the green period that tens to align with major pivots
* You can use this information to vary your trading strategy to better match the expected price behavior.

Gann Waves
* Displays yellow and purple vertical bands that tend to align with local pivots.
* You can match this up with the symbol you’re analyzing to see what patterns tend to happen during similar periods.
* Sometimes stocks will make local highs for 3-4 yellow periods in a row, and then make a lower high. This would indicate a potential change in trend.

This script includes 2 timing indicators:
* Cheat Code displays green and purple timing periods
* Gann Waves displays yellow and blue vertical bars
Both indicators are based on natural cycles, and are visible into the future.
Visibility of both indicators is controlled via the Settings menu.
Cheat Code:
* Displays green periods and purple periods.
* Prices seem to trend more within a green period, both up and down.
* Often there’s major pivots around the middle of a green period, and about 3/4 through.
* Prices seem to chop more within a purple period with lots of volatility and reversals.
* Thin light grey lines appear at regular intervals that tend to align with local pivots.
* Thick grey lines appear around the middle of the green period that tens to align with major pivots
* You can use this information to vary your trading strategy to better match the expected price behavior.
Gann Waves
* Displays yellow and purple vertical bands that tend to align with local pivots.
* You can match this up with the symbol you’re analyzing to see what patterns tend to happen during similar periods.
* Sometimes stocks will make local highs for 3-4 yellow periods in a row, and then make a lower high. This would indicate a potential change in trend.
發行說明
Address bugs in Gann Wave display for daily timeframes.發行說明
Update vertical line colors so that the defaults will work on both light and dark backgrounds, and so that users can change the colors.The new default colors are fuchsia for the thin, frequent lines and aqua for the thicker infrequent lines.
Line width was reduced to compensate for the high contrast default colors used.
發行說明
Update the chart.發行說明
Give the user the ability to separately control the display of purple/teal lines, and the green/purple background timing zones.Purple/teal lines by default are 'on'
Green/purple background timing zones by default are 'off'
發行說明
Add magic levels.Magic levels are 2 sets of horizontal lines. Thick lines and thin lines. The default color for thick lines is white. The default color for thin lines is orange.
These indicate areas of likely support and resistance. They are especially useful when price is near a magic level at the time of a vertical timing line.
發行說明
Bug fixes.發行說明
Correct bug that caused the daily cheat code lines to be displayed 1 day later than they should when compared to the Time Trades web app for crypto only. 發行說明
Correct bug in future purple and teal cheat code lines that cases them to be displayed 1 day later than they should for crypto.發行說明
Add Moon Void of Course (VOC) as dashed orange boxes around the dates where the Moon has no more major aspects left in its current sign.According to traditional astrology interpretation, making trading or business decisions during a VOC Moon can result in poor judgement and errors. However trading decisions taken just before or just after a VOC Moon fair well.
發行說明
Reduce the amount of Moon Void of Course data to 2 years of history and 6 months of future to improve performance.發行說明
Major updates to share in this release:- New lunar transiting aspects with other planets and the sun to 4 minute accuracy
- New label to identify when the moon enters a new sign to 4 minute accuracy
- New lunar transiting aspects to the True Ascending Node. The True Ascending Node's location is accurate within 12 hours, however it moves very slowly so this reduced precision won't affect the end result much.
- New lunar conjunctions and oppositions to the Galactic Center (GC)
- Updated Gann Wave implementation. Instead of broad blue and yellow colors, we've switched to more precision vertical lines. A blue vertical line indicates the minimum of a Gann Wave. A yellow vertical line indicates the maximum of a Gann Wave. Green dotted vertical lines indicate the zero point of the Gann Wave. All are calculated to 4 minutes of accuracy.
- No changes to the Cheat Code or Cheat Code Timing Zones
This is a big script and is pushing the limits of TradingView's scripting engine. If you encounter performance issues please let me know.
發行說明
Only display aspects and Moon Void-of-course on intraday timeframes.發行說明
Hide the aspects and void of course for all timeframes larger than 30 minutes, to prevent chart clutter.For 30 minute timeframes or less, the aspects and void of course will be displayed if selected in the the configuration settings.
發行說明
Fix bug preventing the display of future Cheat Code purple and teal lines.發行說明
- Add the new Likely Pivot Date option. This is a label drawn on a daily basis that tends to identify pivots with +/- 2 days of accuracy. On by default.
- Correct a bug that prevented the Cheat Code colors from being customized.
- Remove the option for Cheat Code Timing Zones and replace it with Eclipse Season (matches the previous purple timing zone)
發行說明
Reorder the input variables to go from highest timeframe (top) to lowest timeframe (bottom), then followed by price levels.Allow the lunar aspects to be turned on/off independently of lunar signs.
Provide more helpful text on the input variables and how they work on different timeframes.
發行說明
- Added new 'small pivots' which are minor pivots that occur more frequently than medium pivots.
- Renamed the 'Likely Pivot Day' features to 'Medium Pivots'
- Added the ability to customize colors for all the elements of the script.
- Reduce label overlap for future labels.
發行說明
Updated script with more future dates.This version contains 45 days of future lunar aspects and 90 days of past lunar aspects relative to June 13th 2022.
發行說明
Always show the Moon void of course, regardless of the timeframe.Display the polarity of the small pivot and medium pivot cycles.
Add the date range of the data encoded in the script on the input screen.
發行說明
Include one year of history of lunar signs.Color-code Aquarius and Leo
Display lunar signs on 4 hr timeframes and lower
發行說明
Display only Aquarius and Leo on 240 minute or higher charts.發行說明
Fixes bug caused by negative crude futures prices.發行說明
Update the embedded data發行說明
Update embedded data.發行說明
Updated data range.發行說明
Reduce overlap of labels on historical price bars by stacking labels vertically.Performance improvements.
Display moon-enters-sign on daily bars.
Display the time of each label using the Exchange timezone instead of UTC.
發行說明
On the daily timeframe, only show Leo and Aquarius and hide other lunar signs to reduce clutter.發行說明
Fix bug that resulted in displaying the same label twice. Work around TradingView label display bug by correcting the future timestamps by 1 bar.發行說明
Add new Vedic Intraday indicator and refine locations of labels.發行說明
Bug fix for Vedic Intraday label tooltips.發行說明
Minor bug fix to label tooltip for Vedic Intraday labels.發行說明
Fix minor tooltip formattign bug for lunar signs.發行說明
Update with latest data.發行說明
Updating with the latest data.發行說明
Performance and storage optimizations. Up to a 5x performance improvement.Note that Vedic Intraday labels and Lunar Aspects that occur outside of trading hours will not be displayed.
發行說明
Minor bug fix to correct crooked lines.發行說明
Add more data including Vedic Intraday data through Feb 20.Correct issues that prevented some Gann Wave and Cheat Code lines from appearing on non-crypto symbols.
發行說明
Updated embedded data through March 26 2023.發行說明
Updated internal data.發行說明
Add alert support for price crossing magic levels, and price gapping over magic levels.Change label background colors for debilitation and exaltation to improve contrast on white charts.
Fix a bug in the display of magic levels - white and orange were overlapping in some cases.
Fix a bug in the display of vertical lines that appear in the future - on daily timeframes future Gann Waves appeared a day later than they should.
發行說明
Update embedded data.發行說明
Update with data through 2023-07-31發行說明
Refresh embedded data. Vedic intraday data is included through 2023-09-04.發行說明
Add the new Venus Intervals indicator. See the User Guide for more details.發行說明
Update the chart.發行說明
Update the chart.發行說明
Fix bug that prevented future lines from drawing correctly in some cases.發行說明
Extend Venus Intervals to start at 1980-01-01發行說明
Update with data through 2023-10-29發行說明
Update embedded data and performance optimizations.發行說明
Implemented some performance optimizations.發行說明
Add warning message when the embedded data is within 1 week of expiring.Add error message when the embedded data has expired.
發行說明
Update data through 2024-01-21.發行說明
Add more customizations around line thickness, and improve tooltip descriptions for better usability.發行說明
Update the embedded data 發行說明
Update Vedic intraday indicator with data through 2024-03-25發行說明
Fix a bug preventing the display of future eclipse seasons.發行說明
Massive performance improvements. The script now runs about 90% faster than before.Move the intraday related data points to a different script. The following data points have been moved to the new Time Trades Intraday script:
- Moon Void of Course
- Lunar Aspects
- Vedic Intraday labels
Add the ability to subdivide the White Magic Levels using either the Pythagorean ratios or eighths.
Display the prior days high, low, and close carried forward to the current day.
Display the prior weeks high, low and close carried forward to the current week.
發行說明
Performance update to display of daily and weekly chart levels.發行說明
Add a new method to subdivide white magic levels - using circle geometry.Divides the space between white magic levels into the following proportions of a circle.
- 45*
- 60*
- 90*
- 120*
- 135*
- 180*
- 225*
- 240*
- 270*
- 300*
- 315*
發行說明
Add selective control over the harmonic subdivisions of a white magic level interval. Choose any harmonic between 3-8.Add the option to label the harmonic lines.
發行說明
Update default values of options.發行說明
Correct minor formatting error on the Harmonic Labels.發行說明
Correct issue that was generating runtime errors when a line timestamp occurred within 24 hours of a futures bar.發行說明
- Update default input variables to show Venus Intervals, white magic levels, and the 6th harmonic subdivision by default.
- Fix bug that prevented the drawing of lines and labels that occur during non trading times.
- Add 12th harmonic option as a white magic level subdivision.
發行說明
Fix bug causing a crash when displaying lunar declinations.僅限邀請腳本
僅限作者授權的用戶訪問此腳本,並且通常需要付費。您可以將其增加到收藏腳本中,但是只有在向作者請求並獲得許可之後,才能使用它。 請聯繫yyctrade以了解更多信息,或按照下面作者的說明進行操作。
TradingView 不建議購買並使用此腳本,除非您 100% 信任其作者並了解腳本的工作原理。在許多情況下,您可以在我們的社群腳本中免費找到良好的開源替代方案。
作者的說明
″This script is part of the Time Trades service.
To get access sign up at time-trades.com
Refer to the User Guide here: https://publish.obsidian.md/time-trades/TradingView+Scripts/Time+Trades+TV+Script
想在圖表上使用此腳本?
警告:請閱讀,然後再請求訪問權限。
Time Trades is a data service that combines machine learning and Gann techniques to provide time centric forecasts. These are intended to be combined with your existing price analysis to provide a trading edge.
免責聲明
這些資訊和出版物並不意味著也不構成TradingView提供或認可的金融、投資、交易或其他類型的意見或建議。請在使用條款閱讀更多資訊。