OPEN-SOURCE SCRIPT
Red-Fall% Rebound · Daily Lowest Entry Only [Indicator v6]
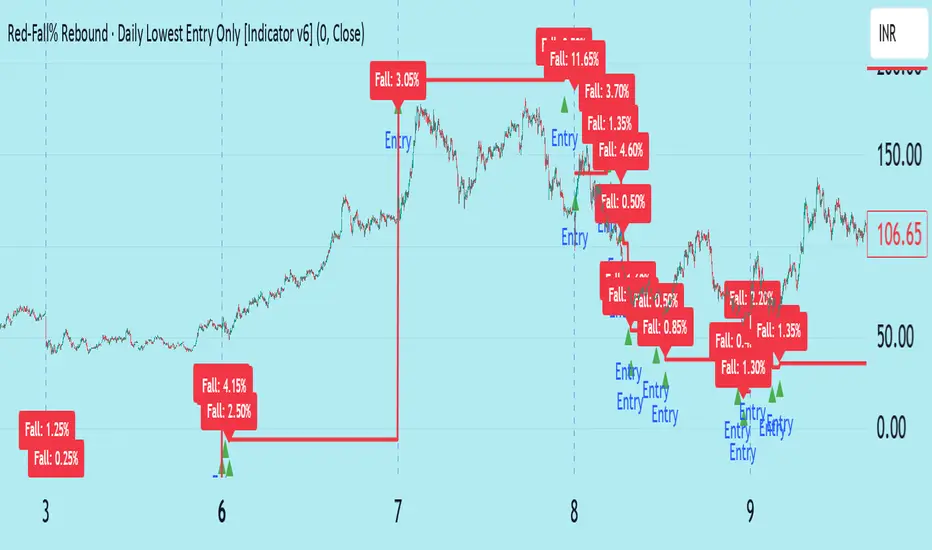
This indicator identifies rebound opportunities following strong bearish (“red”) candles.
It measures the percentage fall of each red candle, then waits for the next candle to cross above its own open price multiplied by that same fall percentage — meaning price has rebounded by the same strength it fell.
Once such a crossover occurs, it’s marked as an entry signal (green triangle).
A label is placed on the previous red candle showing its fall percentage.
Unique Daily Logic:
At the start of each day, the indicator resets its memory.
It saves the first valid entry of the day.
If a later entry appears at a lower price than the first, it replaces the earlier one.
Higher-priced entries the same day are ignored — ensuring only the lowest valid entry per day is highlighted.
Visual Elements:
🔴 Red bar coloring for bearish candles.
🟩 Green triangle under the bar marking the accepted (lowest) entry of the day.
🏷️ Label above the previous red bar showing its percentage fall.
🔻 Optional red line showing a hypothetical stop level based on that fall%.
(No trades are executed — this is purely visual.)
Alerts:
Triggers when a new accepted entry signal appears (i.e., first or lower entry of the day).
You can use this for real-time notifications or automation with webhooks.
Parameters:
Show labels → Toggle fall% labels on/off.
Show stop line → Display/hide the hypothetical stop line.
Minimum fall % → Ignore very small red bars.
Entry price proxy → Choose how the entry level is estimated (Close, Open, or Level = open × (1 + fall%)).
Enable alert condition → Turn alerts on/off.
How to Use:
Add the script to your chart.
Adjust Minimum fall % to focus on significant red bars (e.g., 1–3%).
Watch for green triangles — those are the day’s first or lowest valid rebound entries.
Use the red stop line (optional) as a reference for risk management.
The trade is left open manually — there is no take-profit logic.
開源腳本
本著TradingView的真正精神,此腳本的創建者將其開源,以便交易者可以查看和驗證其功能。向作者致敬!雖然您可以免費使用它,但請記住,重新發佈程式碼必須遵守我們的網站規則。
免責聲明
這些資訊和出版物並不意味著也不構成TradingView提供或認可的金融、投資、交易或其他類型的意見或建議。請在使用條款閱讀更多資訊。
開源腳本
本著TradingView的真正精神,此腳本的創建者將其開源,以便交易者可以查看和驗證其功能。向作者致敬!雖然您可以免費使用它,但請記住,重新發佈程式碼必須遵守我們的網站規則。
免責聲明
這些資訊和出版物並不意味著也不構成TradingView提供或認可的金融、投資、交易或其他類型的意見或建議。請在使用條款閱讀更多資訊。