OPEN-SOURCE SCRIPT
Qossai Stock Info
### Qossai Stock Info Indicator
This indicator provides a concise overlay of essential stock information directly on your chart, presented in a clean, organized table. Designed for quick glances, it helps traders and investors stay informed about key fundamental and volatility metrics of the currently viewed symbol.
**Key Features:**
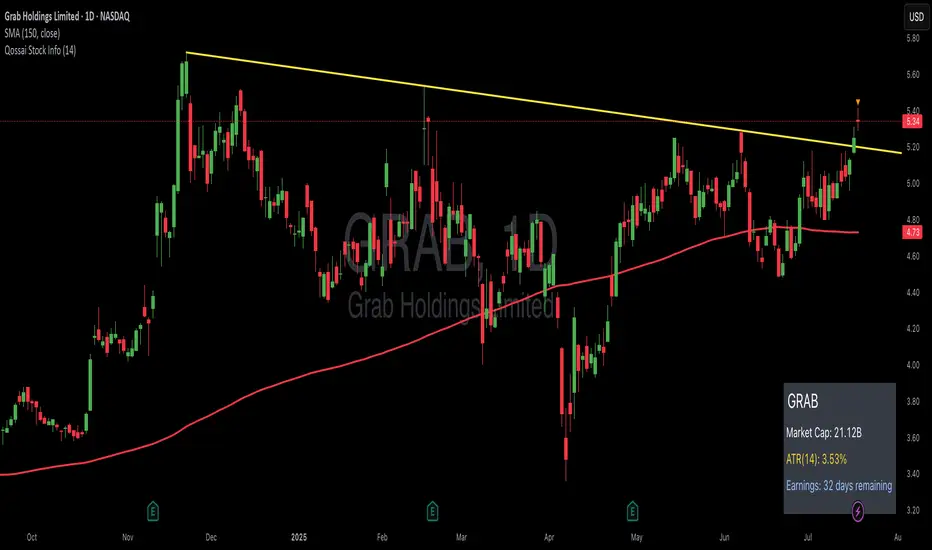
* **Symbol/Ticker Display:** Clearly shows the ticker of the asset you are currently viewing.
* **Dynamic Market Capitalization (Market Cap):** Automatically calculates and displays the market capitalization in a readable format (Millions, Billions, or Trillions), providing instant insight into the company's size.
* **Average True Range (ATR) as Percentage:** Shows the 14-day Average True Range (a measure of volatility) as a percentage of the closing price, helping you gauge the typical price movement. The ATR period is customizable.
* **Earnings Countdown:** Keep track of upcoming events with a precise countdown displaying the number of days remaining until the next earnings announcement. This feature can be toggled on or off via the indicator's settings.
* **Clean Table Format:** All information is presented neatly in a table with a subtle black background, ensuring readability without cluttering your main chart view.
**How to Use:**
Simply add the "Qossai Stock Info" indicator to your chart. You can adjust the ATR length and toggle the earnings countdown visibility from the indicator's settings.
**Purpose:**
This tool aims to simplify access to critical stock data, empowering users to make quicker, more informed decisions by having vital information readily available on their screen.
---
This indicator provides a concise overlay of essential stock information directly on your chart, presented in a clean, organized table. Designed for quick glances, it helps traders and investors stay informed about key fundamental and volatility metrics of the currently viewed symbol.
**Key Features:**
* **Symbol/Ticker Display:** Clearly shows the ticker of the asset you are currently viewing.
* **Dynamic Market Capitalization (Market Cap):** Automatically calculates and displays the market capitalization in a readable format (Millions, Billions, or Trillions), providing instant insight into the company's size.
* **Average True Range (ATR) as Percentage:** Shows the 14-day Average True Range (a measure of volatility) as a percentage of the closing price, helping you gauge the typical price movement. The ATR period is customizable.
* **Earnings Countdown:** Keep track of upcoming events with a precise countdown displaying the number of days remaining until the next earnings announcement. This feature can be toggled on or off via the indicator's settings.
* **Clean Table Format:** All information is presented neatly in a table with a subtle black background, ensuring readability without cluttering your main chart view.
**How to Use:**
Simply add the "Qossai Stock Info" indicator to your chart. You can adjust the ATR length and toggle the earnings countdown visibility from the indicator's settings.
**Purpose:**
This tool aims to simplify access to critical stock data, empowering users to make quicker, more informed decisions by having vital information readily available on their screen.
---
開源腳本
秉持TradingView一貫精神,這個腳本的創作者將其設為開源,以便交易者檢視並驗證其功能。向作者致敬!您可以免費使用此腳本,但請注意,重新發佈代碼需遵守我們的社群規範。
免責聲明
這些資訊和出版物並非旨在提供,也不構成TradingView提供或認可的任何形式的財務、投資、交易或其他類型的建議或推薦。請閱讀使用條款以了解更多資訊。
免責聲明
這些資訊和出版物並非旨在提供,也不構成TradingView提供或認可的任何形式的財務、投資、交易或其他類型的建議或推薦。請閱讀使用條款以了解更多資訊。