OPEN-SOURCE SCRIPT
Comparaison DXY, VIX, SPX, DJI, GVZ
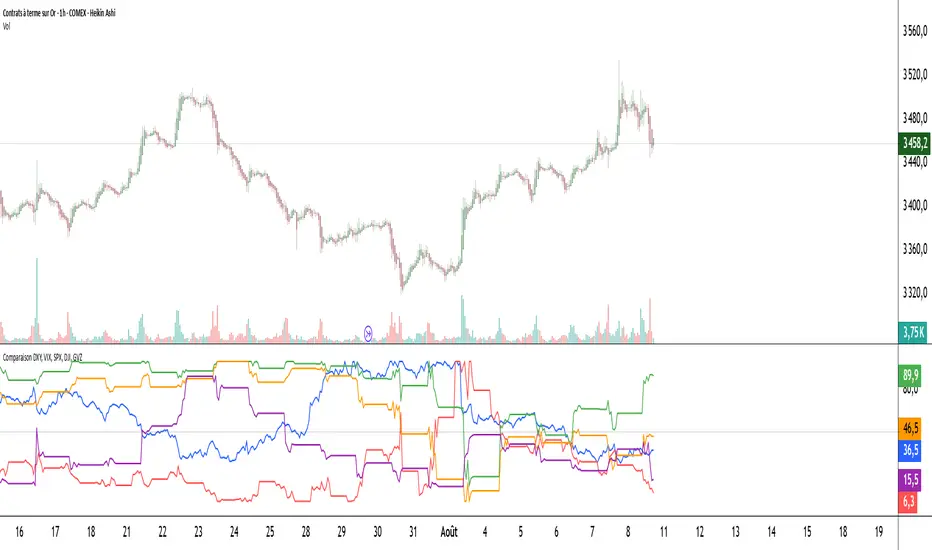
Pine Script indicator compares the normalized values of DXY, VIX, SPX, DJI, and GVZ indices on a single scale from 0 to 100. Here's a breakdown of what it does:
Data Requests: Gets closing prices for:
US Dollar Index (DXY)
VIX Volatility Index
S&P 500 (SPX)
Dow Jones Industrial Average (DJI)
Gold Volatility Index (GVZ)
Normalization: Each index is normalized using a 500-period lookback to scale values between 0-100, making them comparable despite different price scales.
Visualization:
Plots each normalized index with distinct colors
Adds a dotted midline at 50 for reference
Uses thicker linewidth (2) for better visibility
Timeframe Flexibility: Works on any chart timeframe since it uses timeframe.period
This is useful for:
Comparing relative strength/weakness between these key market indicators
Identifying divergences or convergences in their movements
Seeing how different asset classes (currencies, equities, volatility) relate
You could enhance this by:
Adding correlation calculations between pairs
Including options to adjust the normalization period
Adding alerts when instruments diverge beyond certain thresholds
Including volume or other metrics alongside price
開源腳本
秉持TradingView一貫精神,這個腳本的創作者將其設為開源,以便交易者檢視並驗證其功能。向作者致敬!您可以免費使用此腳本,但請注意,重新發佈代碼需遵守我們的社群規範。
免責聲明
這些資訊和出版物並非旨在提供,也不構成TradingView提供或認可的任何形式的財務、投資、交易或其他類型的建議或推薦。請閱讀使用條款以了解更多資訊。
開源腳本
秉持TradingView一貫精神,這個腳本的創作者將其設為開源,以便交易者檢視並驗證其功能。向作者致敬!您可以免費使用此腳本,但請注意,重新發佈代碼需遵守我們的社群規範。
免責聲明
這些資訊和出版物並非旨在提供,也不構成TradingView提供或認可的任何形式的財務、投資、交易或其他類型的建議或推薦。請閱讀使用條款以了解更多資訊。