OPEN-SOURCE SCRIPT
DEVPRO Trading
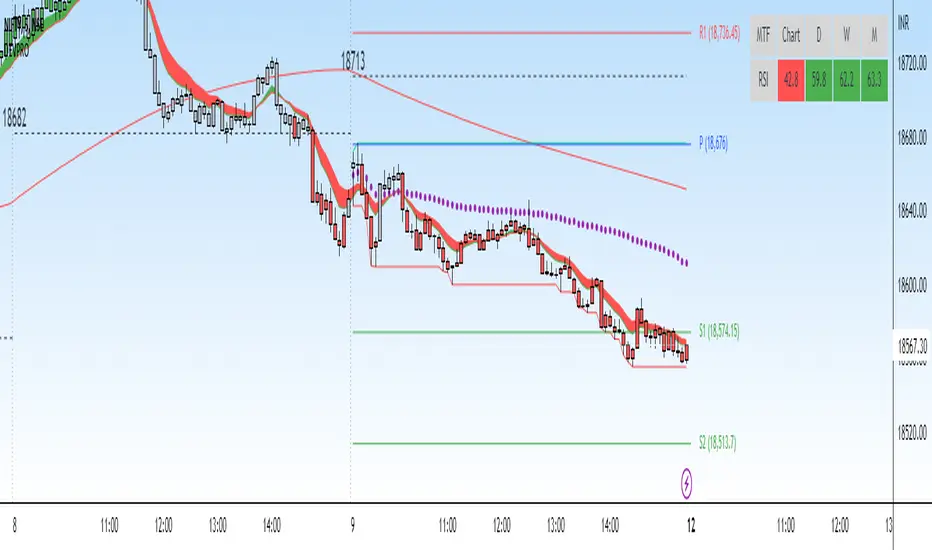
DEVPRO Trading system comprises of the following:
D - Double (EMA and VWAP)
E - EMA
V - VWAP (current and previous day ending VWAP level)
P - Standard Pivot Point
R - RSI (Multi-time frame table is added at the top and traders can add standard RSI 14 as an additional non-overlay indicator)
O - OI data (not available for options trading in TV but trader can always check in their broker terminal)
Double EMA have been color coded in red and green for bullish and bearish trends.
Candles are colored for bullish (green), sideways (grey) and bearish (red) phases.
Setup to be traded with monthly options for stocks and weekly options for indices.
Bullish Setup:
RSI greater than 50
Current candle close above VWAP and previous day closing VWAP
Current candle close above daily Pivot
For option buying (Call option OI should be falling below its moving average 20 meaning short covering)
For option selling (Put option OI should be rising above its moving average 20 meaning Put writers confidence is increasing)
Book partial qty profits at R1/R2/R3 and/or exit completely on Doji candle low break
Bearish Setup:
RSI less than 50
Current candle close below VWAP and previous day closing VWAP
Current candle close below daily Pivot
For option buying (Put option OI should be falling below its moving average 20 meaning short covering)
For option selling (Call option OI should be rising above its moving average 20 meaning Call writers confidence is increasing)
Book partial qty profits at S1/S2/S3 and/or exit completely on Doji candle high break
開源腳本
秉持TradingView一貫精神,這個腳本的創作者將其設為開源,以便交易者檢視並驗證其功能。向作者致敬!您可以免費使用此腳本,但請注意,重新發佈代碼需遵守我們的社群規範。
免責聲明
這些資訊和出版物並非旨在提供,也不構成TradingView提供或認可的任何形式的財務、投資、交易或其他類型的建議或推薦。請閱讀使用條款以了解更多資訊。
開源腳本
秉持TradingView一貫精神,這個腳本的創作者將其設為開源,以便交易者檢視並驗證其功能。向作者致敬!您可以免費使用此腳本,但請注意,重新發佈代碼需遵守我們的社群規範。
免責聲明
這些資訊和出版物並非旨在提供,也不構成TradingView提供或認可的任何形式的財務、投資、交易或其他類型的建議或推薦。請閱讀使用條款以了解更多資訊。