INVITE-ONLY SCRIPT
已更新 US Market Strength Index
Intro:
It is quite a task to track multiple Indices and market internals to decide which way markets are going, especially when you are in a Trade. You may also get conflicting signals making it harder to confidently decide on your trade bias.
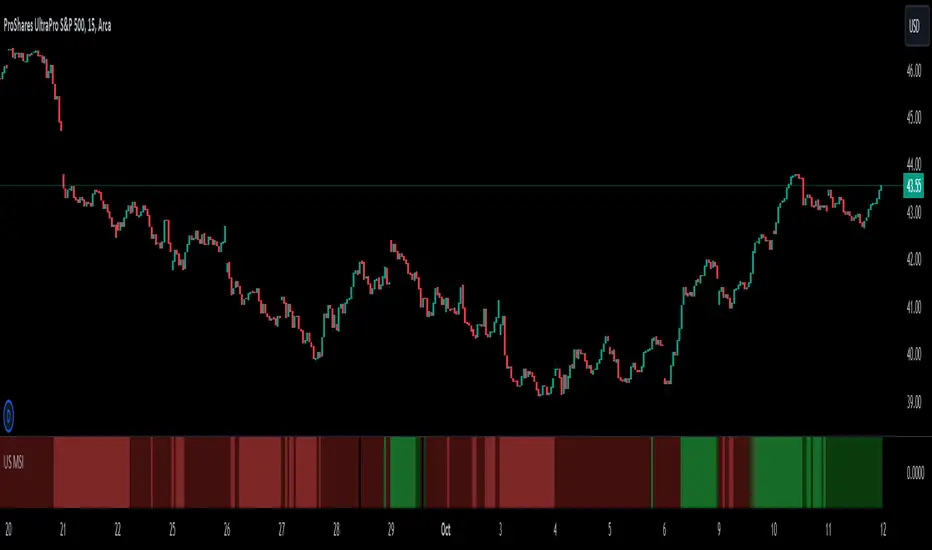
US Market Strength Index a.k.a. US MSI indicator aims to simplify decision-making by coloring the lower panel Green when a majority of market participants are bullish and Red when they are bearish. The code analyses the direction and strength of various US indices & market internal futures contracts to decide the color. The shade of color also changes from Dark to Bright when the momentum is relatively strong. A weighted score is assigned to individual contracts and the color (& shade) are selected based on average score in real-time, for changes in direction and momentum.
A Futures contract provides a proxy and generates price & volume data to analyze the direction and strength. Also, they are traded by sophisticated market participants for about 23 hours a day!
Trading with the general market sentiment in your favor can potentially improve a trade's edge. For example, if various market indices (DOW JONES, S&P 500, NASDAQ, etc.) are positive; bullish, or LONG trades might work out in individual stocks. This may occur due to the following reasons:
The same logic applies when the market indices are in the negative territory, SHORT trades may have a higher probability of working out.
Features:
Basic Set-Up:
Important Notes:
It is quite a task to track multiple Indices and market internals to decide which way markets are going, especially when you are in a Trade. You may also get conflicting signals making it harder to confidently decide on your trade bias.
US Market Strength Index a.k.a. US MSI indicator aims to simplify decision-making by coloring the lower panel Green when a majority of market participants are bullish and Red when they are bearish. The code analyses the direction and strength of various US indices & market internal futures contracts to decide the color. The shade of color also changes from Dark to Bright when the momentum is relatively strong. A weighted score is assigned to individual contracts and the color (& shade) are selected based on average score in real-time, for changes in direction and momentum.
A Futures contract provides a proxy and generates price & volume data to analyze the direction and strength. Also, they are traded by sophisticated market participants for about 23 hours a day!
Trading with the general market sentiment in your favor can potentially improve a trade's edge. For example, if various market indices (DOW JONES, S&P 500, NASDAQ, etc.) are positive; bullish, or LONG trades might work out in individual stocks. This may occur due to the following reasons:
- Seeing prices rise, Sellers may choose to Sell at Higher prices
- Buyers might be attracted to buy into stocks, as the prices are trending higher
- SHORT sellers might get cautious of rising prices and may not Open SHORT positions until the current bullish sentiment dies off
- Existing SHORT sellers may close their positions due to margin squeeze, possibily fueling more buying
The same logic applies when the market indices are in the negative territory, SHORT trades may have a higher probability of working out.
Features:
- The bright Green color in the lower panel indicates a strong bullish market strength
- The dark Green color in the lower panel indicates bullish market strength, but a relatively weaker
- The bright Red color in the lower panel indicates a strong bearish market strength
- The dark Red color in the lower panel indicates bearish market strength, but a relatively weaker
Basic Set-Up:
- Add the Indicator to the chart
- You can change the default colors for Market Bearish, Market Bullish, Market Bearish weak, and Market Bullish weak
Important Notes:
- You should analyze the stock’s technical data and use prudent risk management for every trade. Trade entries and exits should always be based on the symbol you are trading.
- Use the US Market Strength Index as one of the factors to decide your trade bias and filter symbols that support your analysis.
- Just because Indices and Market Internals point in a certain direction, it does not guaranteed that a stock could behave the same way.
- Also, since this script uses futures contracts, you would need real-time futures data subscription for real-time analysis. At the minimum, you need CME/ CBOE exchange data.
- This tool is suited for US Regular Trading Session, but since the US MSI is using futures contracts, the tool tracks pre- and post-market sentiment as well.
發行說明
V2--- Minor Code Revision
僅限邀請腳本
僅作者批准的使用者才能訪問此腳本。您需要申請並獲得使用許可,通常需在付款後才能取得。更多詳情,請依照作者以下的指示操作,或直接聯絡SnowflakeTrader。
TradingView不建議在未完全信任作者並了解其運作方式的情況下購買或使用腳本。您也可以在我們的社群腳本中找到免費的開源替代方案。
作者的說明
Go To https://www.snowflaketrader.com/trader-resources to get access to this Indicator.
Visit snowflaketrader.com to get access to Free & Premium resources for Traders
Email : support@snowflaketrader.com
WhatsApp (Messages Only) : +1 341 345 8266
Discord : snowflaketrader
Email : support@snowflaketrader.com
WhatsApp (Messages Only) : +1 341 345 8266
Discord : snowflaketrader
免責聲明
這些資訊和出版物並非旨在提供,也不構成TradingView提供或認可的任何形式的財務、投資、交易或其他類型的建議或推薦。請閱讀使用條款以了解更多資訊。