PROTECTED SOURCE SCRIPT
M.Ataoglu_Super_Ortalamalar | M.Ataoglu_Super_Averages
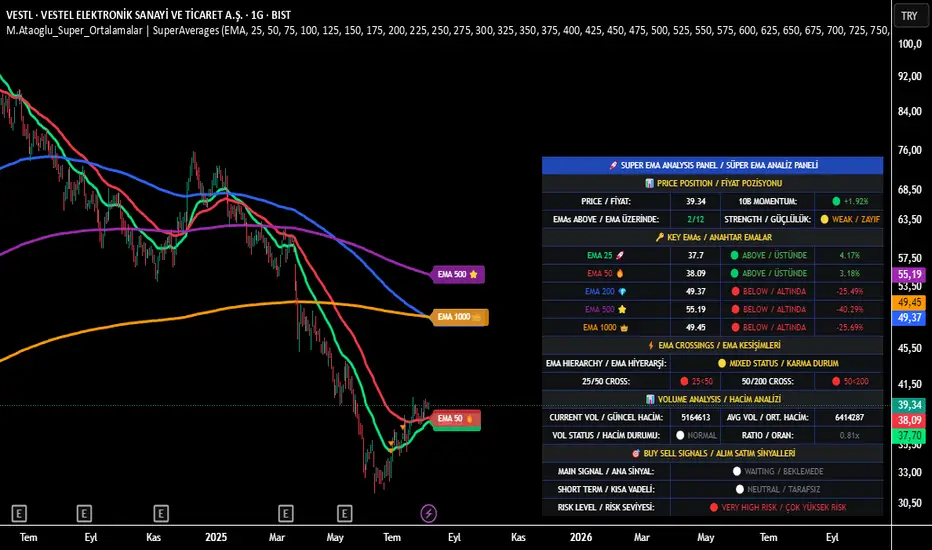
📊 M.Ataoglu Super Averages - Multi-Moving Average Analysis System
English Description:
M.Ataoglu Super Averages is a comprehensive multi-moving average analysis system that provides advanced technical analysis using 40 different moving average periods ranging from 25 to 1000 periods. This indicator combines multiple technical analysis concepts to deliver powerful trading signals and market insights.
🔧 How It Works:
The system calculates 40 different moving averages using 8 different MA types (EMA, SMA, VWMA, WMA, HMA, DEMA, TEMA, KAMA) across four time horizons:
Short-term (25-125 periods): 5 EMAs for immediate market direction
Medium-term (150-375 periods): 11 EMAs for intermediate trend analysis
Long-term (400-600 periods): 9 EMAs for major trend identification
Super long-term (625-1000 periods): 15 EMAs for structural market analysis
📈 Core Analysis Methods:
EMA Hierarchy Analysis: Evaluates the alignment of key EMAs (25, 50, 200, 500, 1000) to determine overall market structure
Volume Analysis: Compares current volume to 20-period average to identify volume breakouts and confirm signals
Momentum Tracking: Calculates momentum for price and key EMAs to detect acceleration/deceleration
Cross Signal Generation: Monitors golden/death crosses at multiple timeframes for entry/exit signals
Risk Assessment: Provides risk levels based on EMA alignment and market conditions
🎯 Signal Generation Logic:
Strong Buy: 8+ bullish EMAs + EMA hierarchy + high volume
Buy: 6+ bullish EMAs + EMA 25 > EMA 50
Sell: 4 or fewer bullish EMAs + bearish hierarchy
Strong Sell: 2 or fewer bullish EMAs + bearish hierarchy + high volume
⚙️ Key Features:
8 different moving average types for flexibility
Comprehensive volume analysis with ratio calculations
Advanced momentum tracking system
Multiple alert conditions for different market scenarios
Visual table display with real-time market status
Risk level assessment based on EMA alignment
Support for multiple timeframes and instruments
📊 Usage Guidelines:
Use for trend identification across multiple timeframes
Combine with volume analysis for signal confirmation
Monitor EMA hierarchy for overall market structure
Use momentum indicators for entry/exit timing
Apply risk management based on provided risk levels
⚠️ Risk Disclaimer:
This indicator is for educational and analysis purposes only. Past performance does not guarantee future results. Always use proper risk management and consider multiple factors before making trading decisions.
受保護腳本
此腳本以閉源形式發佈。 不過,您可以自由使用,沒有任何限制 — 點擊此處了解更多。
免責聲明
這些資訊和出版物並非旨在提供,也不構成TradingView提供或認可的任何形式的財務、投資、交易或其他類型的建議或推薦。請閱讀使用條款以了解更多資訊。
受保護腳本
此腳本以閉源形式發佈。 不過,您可以自由使用,沒有任何限制 — 點擊此處了解更多。
免責聲明
這些資訊和出版物並非旨在提供,也不構成TradingView提供或認可的任何形式的財務、投資、交易或其他類型的建議或推薦。請閱讀使用條款以了解更多資訊。