OPEN-SOURCE SCRIPT
FDL Horizontal Levels + EMAs (US30 & YM1)
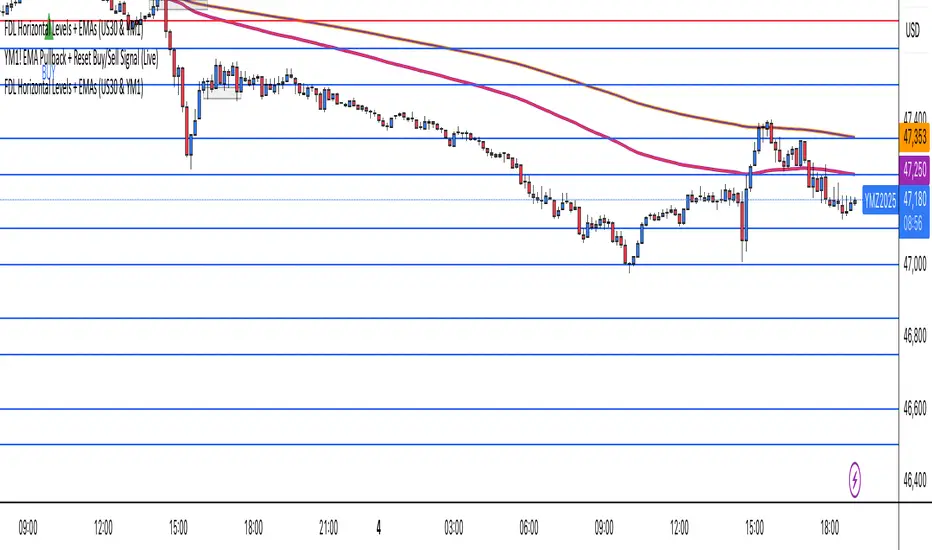
This indicator automatically plots institutional horizontal levels for US30 and YM1, so you don’t have to mark them manually. It also shows the 100 EMA and 200 EMA on all timeframes.
Horizontal levels are displayed on 3, 5, 10, 15, and 30-minute charts.
Horizontal levels are displayed on 3, 5, 10, 15, and 30-minute charts.
開源腳本
本著TradingView的真正精神,此腳本的創建者將其開源,以便交易者可以查看和驗證其功能。向作者致敬!雖然您可以免費使用它,但請記住,重新發佈程式碼必須遵守我們的網站規則。
免責聲明
這些資訊和出版物並不意味著也不構成TradingView提供或認可的金融、投資、交易或其他類型的意見或建議。請在使用條款閱讀更多資訊。
開源腳本
本著TradingView的真正精神,此腳本的創建者將其開源,以便交易者可以查看和驗證其功能。向作者致敬!雖然您可以免費使用它,但請記住,重新發佈程式碼必須遵守我們的網站規則。
免責聲明
這些資訊和出版物並不意味著也不構成TradingView提供或認可的金融、投資、交易或其他類型的意見或建議。請在使用條款閱讀更多資訊。