OPEN-SOURCE SCRIPT
Enhanced Predictive Model

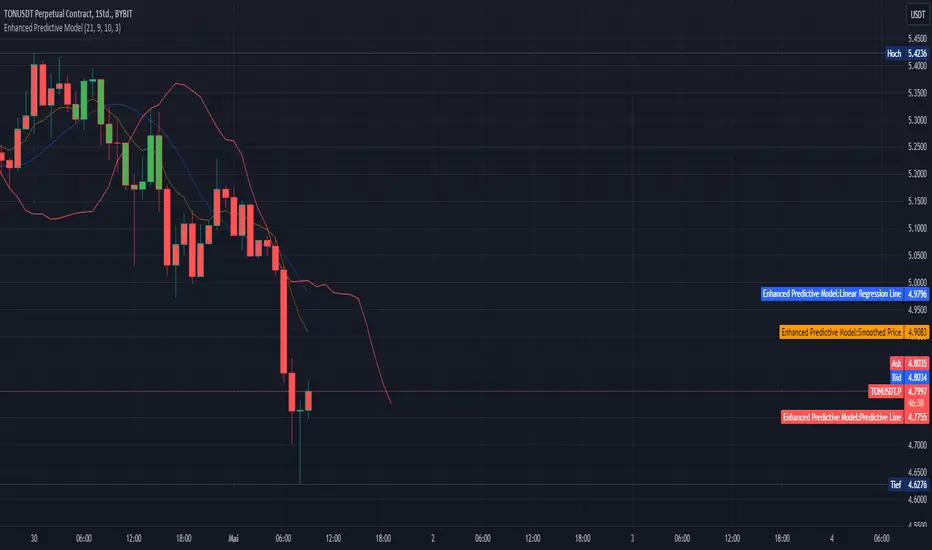
The "Enhanced Predictive Model" is a sophisticated TradingView indicator designed for traders looking for advanced predictive insights into market trends. This model leverages smoothed price data through an Exponential Moving Average (EMA) to ensure a more stable trend analysis and mitigate the effects of price volatility.
**Features of the Enhanced Predictive Model:**
- **Linear Regression Analysis**: Calculates a regression line over the smoothed price data to determine the prevailing market trend.
- **Predictive Trend Line**: Projects future market behavior by extending the current trend line based on the linear regression analysis.
- **EMA Smoothing**: Utilizes a dynamic smoothing mechanism to provide a clear view of the trend without the noise typically associated with raw price data.
- **Visual Trend Indicators**: Offers immediate visual cues through bar coloring, which changes based on the trend direction detected by the regression slope. Green indicates an uptrend, while red suggests a downtrend.
**Key Inputs:**
- **Regression Length**: Determines the number of bars used for the regression analysis, allowing customization based on the user's trading strategy.
- **EMA Length**: Sets the smoothing parameter for the EMA, balancing responsiveness and stability.
- **Future Bars Prediction**: Defines how many bars into the future the predictive line should extend, providing foresight into potential price movements.
- **Smoothing Length**: Adjusts the sensitivity of the trend detection, ideal for different market conditions.
This tool is ideal for traders focusing on medium to long-term trends and can be used across various markets, including forex, stocks, and cryptocurrencies. Whether you are a day trader or a long-term investor, the "Enhanced Predictive Model" offers valuable insights to help anticipate market moves and enhance your trading decisions.
**Usage Tips:**
- Best used in markets with moderate volatility for clearer trend identification.
- Combine with volume indicators or oscillators for a comprehensive trading strategy.
**Recommended for:**
- Trend Following
- Market Prediction
- Volatility Assessment
By employing this indicator, traders can not only follow the market trend but also anticipate changes, giving them a strategic edge in their trading activities.
開源腳本
秉持TradingView一貫精神,這個腳本的創作者將其設為開源,以便交易者檢視並驗證其功能。向作者致敬!您可以免費使用此腳本,但請注意,重新發佈代碼需遵守我們的社群規範。
免責聲明
這些資訊和出版物並非旨在提供,也不構成TradingView提供或認可的任何形式的財務、投資、交易或其他類型的建議或推薦。請閱讀使用條款以了解更多資訊。
開源腳本
秉持TradingView一貫精神,這個腳本的創作者將其設為開源,以便交易者檢視並驗證其功能。向作者致敬!您可以免費使用此腳本,但請注意,重新發佈代碼需遵守我們的社群規範。
免責聲明
這些資訊和出版物並非旨在提供,也不構成TradingView提供或認可的任何形式的財務、投資、交易或其他類型的建議或推薦。請閱讀使用條款以了解更多資訊。