OPEN-SOURCE SCRIPT
已更新 Break-Even Line - JD
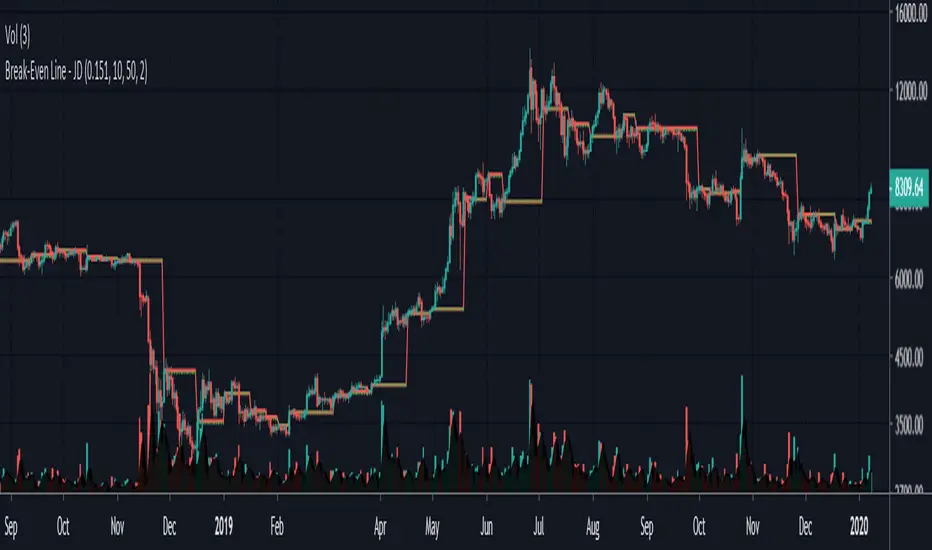
This gives you a simple visual representation of fees implications.
This indicator can give you an insight of what timeframes are worth trading, and at what timeframes your profit will be "eaten by fees"
The indicator shows, how far price has to move from the last swing points (if you entered there) to break-even after fees
As long as you're 'in the red' you P/L after fees will be negative!!
The fees are added once for entry and once for exit, so you have to enter the fees per transaction
(eg in BitSeven this is 0.075%/trans for BTC and 0.151%/trans for ETH)
Of course this can be used for any market.
JD.
#NotTradingAdvice #DYOR
I build thes indicators for myself and provide them open source, to use for free to use and improve upon,
as I believe the best way to learn is toghether.
發行說明
Changed the entry value to the "close" at the time of the "pivot signal" instead of the pivot value itself, to have a more realistic entry and break-even point .JD.
發行說明
update to v4.開源腳本
秉持TradingView一貫精神,這個腳本的創作者將其設為開源,以便交易者檢視並驗證其功能。向作者致敬!您可以免費使用此腳本,但請注意,重新發佈代碼需遵守我們的社群規範。
Disclaimer.
I AM NOT A FINANCIAL ADVISOR.
THESE IDEAS ARE NOT ADVICE AND ARE FOR EDUCATION PURPOSES ONLY.
ALWAYS DO YOUR OWN RESEARCH!
JD.
You can contact me for info/access in PM or on Telegram: @jduyck
PLS, DON'T ASK FOR ACCESS IN THE COMMENT SECTION!
I AM NOT A FINANCIAL ADVISOR.
THESE IDEAS ARE NOT ADVICE AND ARE FOR EDUCATION PURPOSES ONLY.
ALWAYS DO YOUR OWN RESEARCH!
JD.
You can contact me for info/access in PM or on Telegram: @jduyck
PLS, DON'T ASK FOR ACCESS IN THE COMMENT SECTION!
免責聲明
這些資訊和出版物並非旨在提供,也不構成TradingView提供或認可的任何形式的財務、投資、交易或其他類型的建議或推薦。請閱讀使用條款以了解更多資訊。
開源腳本
秉持TradingView一貫精神,這個腳本的創作者將其設為開源,以便交易者檢視並驗證其功能。向作者致敬!您可以免費使用此腳本,但請注意,重新發佈代碼需遵守我們的社群規範。
免責聲明
這些資訊和出版物並非旨在提供,也不構成TradingView提供或認可的任何形式的財務、投資、交易或其他類型的建議或推薦。請閱讀使用條款以了解更多資訊。