OPEN-SOURCE SCRIPT
已更新 Abz BTC Investor

Investor indicator:
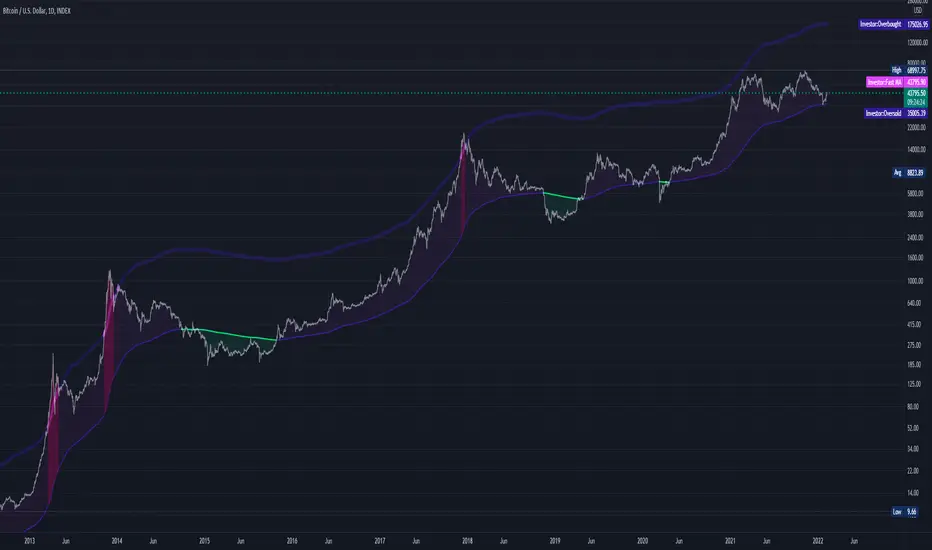
This indicator is intended to be used on a chart showing Bitcoin's historical price action. By viewing years of Bitcoin's history, it's possible to better see Bitcoin's current price within a long term context of the price rage.
Purpose and possible usage:
I built the indicator to make it easier for me and for friends and family to make better informed decisions about our Bitcoin investments. The indicator shows the historic range of the asset and indicates where Bitcoin is oversold (below the bottom line) and overbought (above the top purple line):
- Above the top purple line, I'll look to take some profits or consider hedging to protect my long term position's growth
- Below the bottom purple line, I'll look to dollar cost average into a long term position
I think the idea for this came from idea listening to the YouTuber Birb talking about how well Bitcoin tracked between the 200 day moving average (bottom navy moving average) and 5x that value (top moving average).
Hope you find it useful.
Best wishes,
Abzorba
發行說明
Corrected my code. The old one was a rework of my daily indicator and I had failed to rename the variables. I reworked it to be much simpler and more readable.發行說明
This version adds better in-line notes and I've re-done the intro to correct my initial mislabelling of the moving average.=======================================================================================================
Investor indicator (re-done intro):
This indicator is intended to be used on a chart showing Bitcoin's historical price action using a 2 year moving average. By viewing years of Bitcoin's history, it's possible to better see Bitcoin's current price within a long term context of the price range.
Purpose and possible usage:
I built the indicator to make it easier for me and for friends and family to make better informed decisions about our Bitcoin investments. The indicator shows the historic range of the asset and indicates where Bitcoin is oversold (below the bottom line) and overbought (above the top purple line):
- Above the top purple line, I'll look to take some profits or consider hedging to protect my long term position's growth
- Below the bottom purple line, I'll look to dollar cost average into a long term position
I think the idea for this came from idea listening to the YouTuber Birb talking about how well Bitcoin tracked between the 2 year moving average (bottom navy moving average) and 5x that value (top moving average).
Hope you find it useful.
Best wishes,
Abzorba
開源腳本
秉持TradingView一貫精神,這個腳本的創作者將其設為開源,以便交易者檢視並驗證其功能。向作者致敬!您可以免費使用此腳本,但請注意,重新發佈代碼需遵守我們的社群規範。
Absorbing info with every cycle
免責聲明
這些資訊和出版物並非旨在提供,也不構成TradingView提供或認可的任何形式的財務、投資、交易或其他類型的建議或推薦。請閱讀使用條款以了解更多資訊。
開源腳本
秉持TradingView一貫精神,這個腳本的創作者將其設為開源,以便交易者檢視並驗證其功能。向作者致敬!您可以免費使用此腳本,但請注意,重新發佈代碼需遵守我們的社群規範。
Absorbing info with every cycle
免責聲明
這些資訊和出版物並非旨在提供,也不構成TradingView提供或認可的任何形式的財務、投資、交易或其他類型的建議或推薦。請閱讀使用條款以了解更多資訊。