OPEN-SOURCE SCRIPT
Next Candle Predictor
Next Candle Predictor for TradingView
This Pine Script indicator helps predict potential price movements for the next candle based on historical price action patterns. It analyzes recent candles' characteristics including body size, wick length, and volume to calculate a directional bias.
Key Features
Analyzes recent price action to predict next candle direction (Bullish, Bearish, or Neutral)
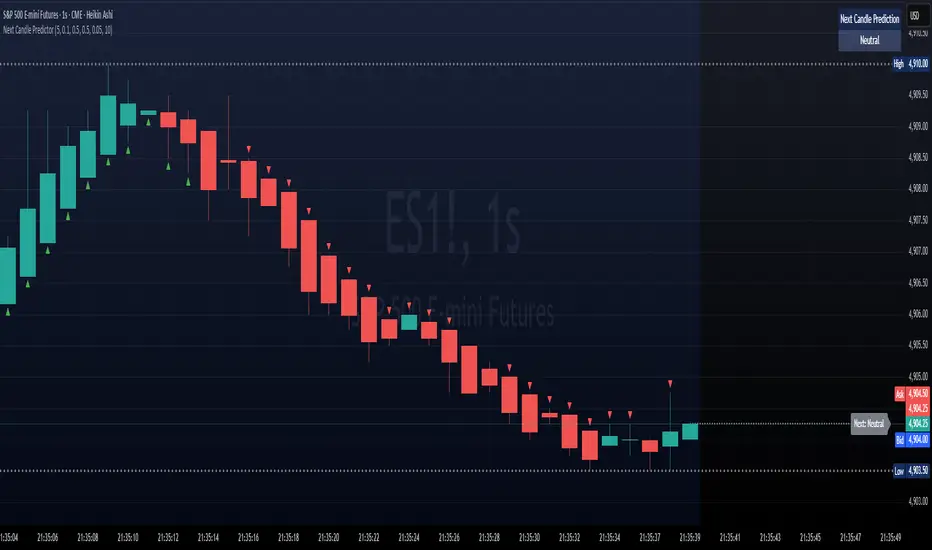
Visual indicators include small directional arrows and a prediction line
Customizable sensitivity and lookback period
Works best on lower timeframes for short-term price action trading
Displays clear prediction labels that extend into future bars
How It Works
The script analyzes recent candles by examining:
Candle body size (weighted by your preference)
Wick length (weighted by your preference)
Volume activity (weighted by your preference)
These factors combine to create a directional strength indicator that determines if the next candle is likely to be bullish, bearish, or neutral.
Visual Feedback
Green up arrows indicate bullish predictions
Red down arrows indicate bearish predictions
A directional line extends from the last candle showing predicted price movement
A label displays the prediction text at the end of the line
Information table in the top right displays the current prediction
Settings
Lookback Candle Count: Number of historical candles to analyze (2-20)
Wick/Body/Volume Weight Factors: Adjust importance of each component
Prediction Sensitivity: Threshold for triggering directional bias
Prediction Line Length: How far the prediction line extends
Perfect for day traders and scalpers looking for an edge in short-term directional bias.
This Pine Script indicator helps predict potential price movements for the next candle based on historical price action patterns. It analyzes recent candles' characteristics including body size, wick length, and volume to calculate a directional bias.
Key Features
Analyzes recent price action to predict next candle direction (Bullish, Bearish, or Neutral)
Visual indicators include small directional arrows and a prediction line
Customizable sensitivity and lookback period
Works best on lower timeframes for short-term price action trading
Displays clear prediction labels that extend into future bars
How It Works
The script analyzes recent candles by examining:
Candle body size (weighted by your preference)
Wick length (weighted by your preference)
Volume activity (weighted by your preference)
These factors combine to create a directional strength indicator that determines if the next candle is likely to be bullish, bearish, or neutral.
Visual Feedback
Green up arrows indicate bullish predictions
Red down arrows indicate bearish predictions
A directional line extends from the last candle showing predicted price movement
A label displays the prediction text at the end of the line
Information table in the top right displays the current prediction
Settings
Lookback Candle Count: Number of historical candles to analyze (2-20)
Wick/Body/Volume Weight Factors: Adjust importance of each component
Prediction Sensitivity: Threshold for triggering directional bias
Prediction Line Length: How far the prediction line extends
Perfect for day traders and scalpers looking for an edge in short-term directional bias.
開源腳本
秉持TradingView一貫精神,這個腳本的創作者將其設為開源,以便交易者檢視並驗證其功能。向作者致敬!您可以免費使用此腳本,但請注意,重新發佈代碼需遵守我們的社群規範。
免責聲明
這些資訊和出版物並非旨在提供,也不構成TradingView提供或認可的任何形式的財務、投資、交易或其他類型的建議或推薦。請閱讀使用條款以了解更多資訊。
開源腳本
秉持TradingView一貫精神,這個腳本的創作者將其設為開源,以便交易者檢視並驗證其功能。向作者致敬!您可以免費使用此腳本,但請注意,重新發佈代碼需遵守我們的社群規範。
免責聲明
這些資訊和出版物並非旨在提供,也不構成TradingView提供或認可的任何形式的財務、投資、交易或其他類型的建議或推薦。請閱讀使用條款以了解更多資訊。