OPEN-SOURCE SCRIPT
Vertical Line on Custom Date
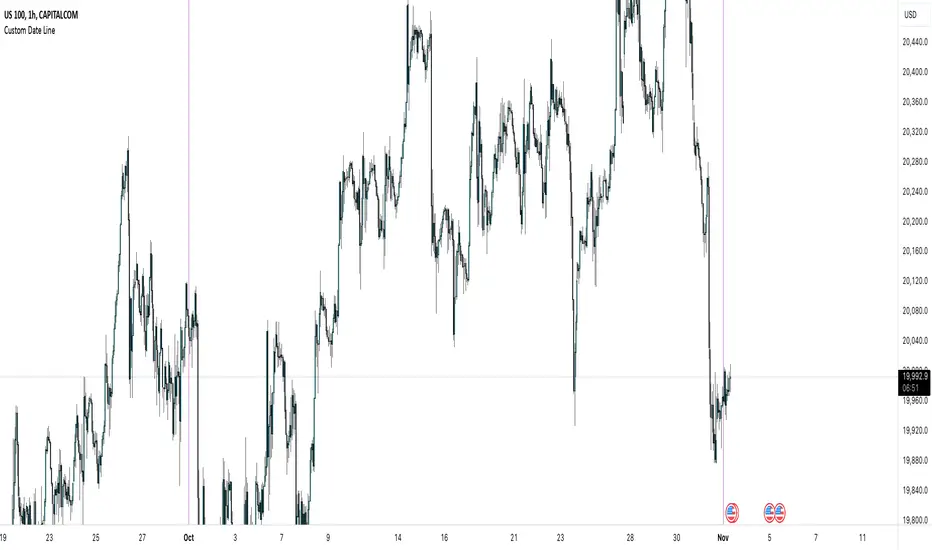
This Pine Script code creates a custom indicator for TradingView that draws a vertical line on the chart at a specific date and time defined by the user.
User Input: Allows the user to specify the day, hour, and minute when the vertical line should appear.
Vertical Line Drawing: When the current date and time match the user’s inputs, a vertical line is drawn on the chart at the corresponding bar, offset by one bar to align properly.
Customizable Color and Width: The vertical line is displayed in purple with a customizable width.
Overall, this indicator helps traders visually mark important dates and times on their price charts.
開源腳本
秉持TradingView一貫精神,這個腳本的創作者將其設為開源,以便交易者檢視並驗證其功能。向作者致敬!您可以免費使用此腳本,但請注意,重新發佈代碼需遵守我們的社群規範。
免責聲明
這些資訊和出版物並非旨在提供,也不構成TradingView提供或認可的任何形式的財務、投資、交易或其他類型的建議或推薦。請閱讀使用條款以了解更多資訊。
開源腳本
秉持TradingView一貫精神,這個腳本的創作者將其設為開源,以便交易者檢視並驗證其功能。向作者致敬!您可以免費使用此腳本,但請注意,重新發佈代碼需遵守我們的社群規範。
免責聲明
這些資訊和出版物並非旨在提供,也不構成TradingView提供或認可的任何形式的財務、投資、交易或其他類型的建議或推薦。請閱讀使用條款以了解更多資訊。