OPEN-SOURCE SCRIPT
Thirdeyechart Global Gold – Last Version
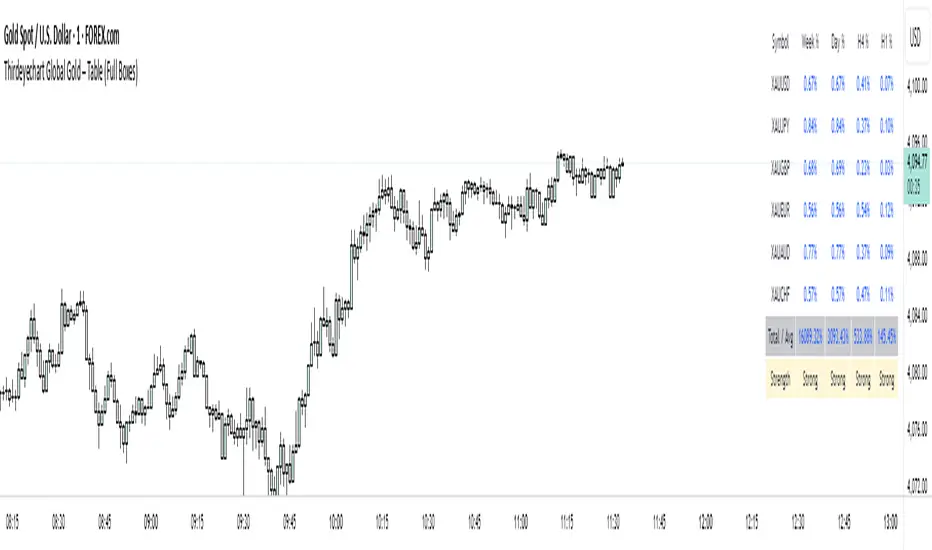
The XAU Solid Trend Table – Last Version is the ultimate TradingView indicator for gold traders who want a clean, professional, and comprehensive view of market direction. This version builds on previous releases by combining percentage changes, multiple timeframes, and a Total Average Calculation into a solid, boxed table that clearly displays strong and weak trends in XAU and its related pairs.
Users can monitor gold across Daily (D), 1-Hour (H1), 4-Hour (H4), and Weekly (W) timeframes. Positive movements are highlighted in blue, negative movements in red, and the Total Average calculation summarizes the overall trend strength, making it easy to spot whether XAU is in a strong uptrend, downtrend, or consolidating.
The table’s solid, boxed layout ensures all information is organized and visually clear, reducing clutter on the chart. This design helps traders quickly interpret market direction, plan trades, and compare multiple pairs like XAU/USD, XAU/JPY, and USD/JPY without confusion.
Coded personally using custom formulas, this indicator emphasizes precision, functionality, and readability. It’s ideal for intraday traders, swing traders, and long-term gold analysts who want a single tool to assess gold’s global movement efficiently.
This script is purely informational and educational. It does not provide buy or sell signals and does not guarantee profits. Traders must perform their own analysis and apply proper risk management before making any trading decisions.
Disclaimer / Copyright:
© 2025 Thirdeyechart. All rights reserved. Redistribution, copying, or commercial use of this code without permission is strictly prohibited. The author is not responsible for any trading losses or financial decisions made based on this script.
開源腳本
秉持TradingView一貫精神,這個腳本的創作者將其設為開源,以便交易者檢視並驗證其功能。向作者致敬!您可以免費使用此腳本,但請注意,重新發佈代碼需遵守我們的社群規範。
免責聲明
這些資訊和出版物並非旨在提供,也不構成TradingView提供或認可的任何形式的財務、投資、交易或其他類型的建議或推薦。請閱讀使用條款以了解更多資訊。
開源腳本
秉持TradingView一貫精神,這個腳本的創作者將其設為開源,以便交易者檢視並驗證其功能。向作者致敬!您可以免費使用此腳本,但請注意,重新發佈代碼需遵守我們的社群規範。
免責聲明
這些資訊和出版物並非旨在提供,也不構成TradingView提供或認可的任何形式的財務、投資、交易或其他類型的建議或推薦。請閱讀使用條款以了解更多資訊。