OPEN-SOURCE SCRIPT
已更新 P/E Ratio vs Median + Bollinger Band
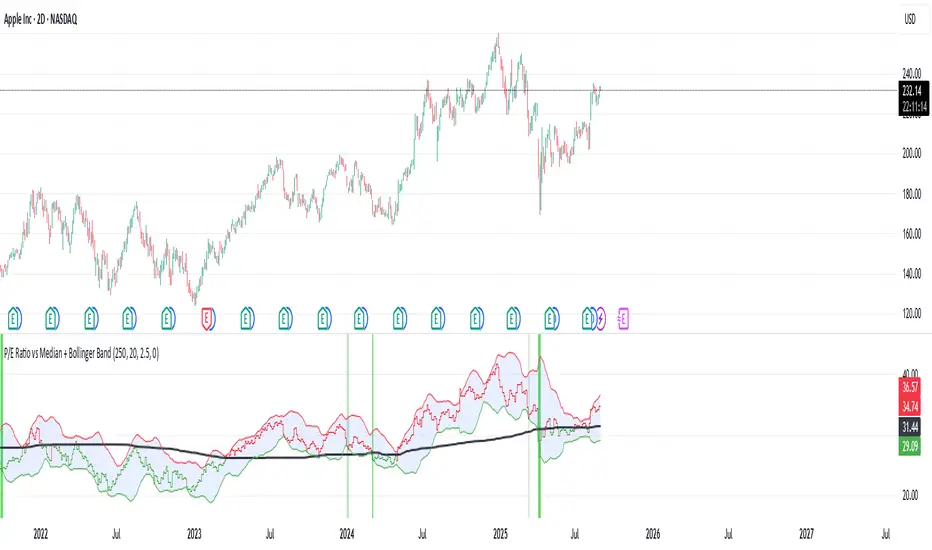
- 📝 This indicator highlights potential buying opportunities by analyzing the Price-to-Earnings (P/E) ratio in relation to Bollinger Bands and its historical median.
- 🎯 The goal is to provide a visually intuitive signal for value-oriented entries, especially when valuation compression aligns with historical context.
- 💡 Vertical green shading is applied when the P/E ratio drops below the lower Bollinger Band, which is calculated directly from the P/E ratio itself — not price. This condition often signals the ticker may be oversold.
- 🟢 Lighter green appears when the ratio is below the lower band but above the median, suggesting a possible shorter-term entry with slightly more risk.
- 🟢 Darker green appears when the ratio is both below the lower band and below the median, pointing to a potentially stronger, longer-term value entry.
- ⚠️ This logic was tested using 1 and 2-day time frames. It may not be as helpful in longer time frames, as the financial data TradingView pulls in begins in Q4 2017.
- ⚠️ Note: This script relies on financial data availability through TradingView. It may not function properly with certain tickers — especially ETFs, IPOs, or thinly tracked assets — where P/S ratio data is missing or incomplete.
- ⚠️ This indicator will not guarantee successful results. Use in conjunction with other indicators and do your due diligence.
- 🤖 This script was iteratively refined with the help of AI to ensure clean logic, minimalist design, and actionable signal clarity.
- 📢 Idea is based on the script "Historical PE ratio vs median" by haribotagada [tradingview.com/script/LYPchnk0-Historical-PE-ratio-vs-median/]
- 💬 Questions, feedback, or suggestions? Drop a comment — I’d love to hear how you’re using it or what you'd like to see changed.
發行說明
Made the Bollinger Band's standard deviation 2.5 by default. This will reduce the amount of shading created, but should provide more reliable entry points. This value can be changed in settings.開源腳本
秉持TradingView一貫精神,這個腳本的創作者將其設為開源,以便交易者檢視並驗證其功能。向作者致敬!您可以免費使用此腳本,但請注意,重新發佈代碼需遵守我們的社群規範。
免責聲明
這些資訊和出版物並非旨在提供,也不構成TradingView提供或認可的任何形式的財務、投資、交易或其他類型的建議或推薦。請閱讀使用條款以了解更多資訊。
開源腳本
秉持TradingView一貫精神,這個腳本的創作者將其設為開源,以便交易者檢視並驗證其功能。向作者致敬!您可以免費使用此腳本,但請注意,重新發佈代碼需遵守我們的社群規範。
免責聲明
這些資訊和出版物並非旨在提供,也不構成TradingView提供或認可的任何形式的財務、投資、交易或其他類型的建議或推薦。請閱讀使用條款以了解更多資訊。