OPEN-SOURCE SCRIPT
已更新 P2-V2 - BTC Strategy
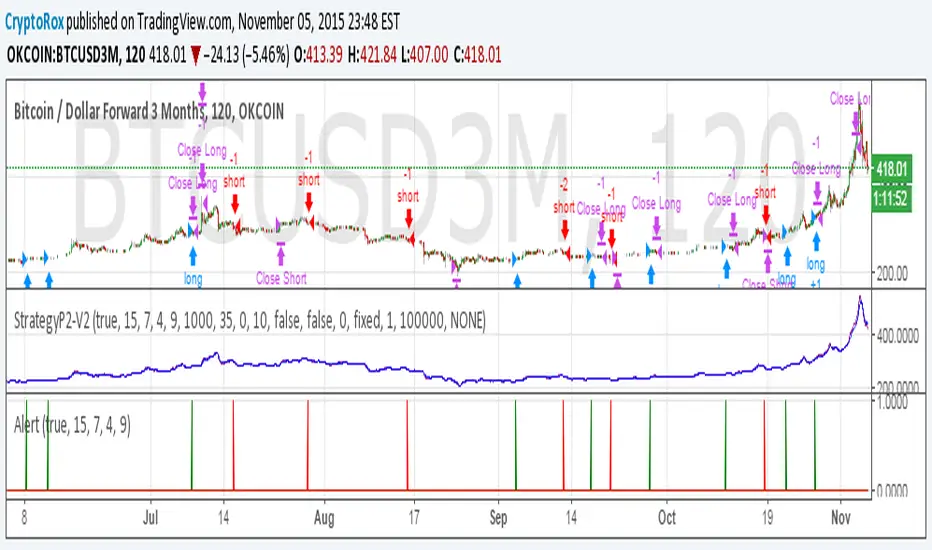
P2-V2 also known as Penner2.0 began with a TEMA and MA cross on Heiken Ashi, a strategy brought to us by a group of crypto traders. Since then we've added a few more indicators and played around with the rules.
This is an early release as I have yet to go through the full automation aspect, however, I know some of you would like to see where it's at.
If you'd like to learn how to automate a full strategy using the Chrome Extension, go to the linked idea for a eurusd setup.
This is an early release as I have yet to go through the full automation aspect, however, I know some of you would like to see where it's at.
If you'd like to learn how to automate a full strategy using the Chrome Extension, go to the linked idea for a eurusd setup.
註釋
Alert Script://version=2
study("P2-V2", shorttitle="Alerts", overlay=false)
//Heiken Ashi Candles
Factor = 3
Pd = 7
isHA = input(true, "HA Candles", bool)
data = isHA ? heikenashi(tickerid) : tickerid
o = security(data, period, open)
h = security(data, period, high)
l = security(data, period, low)
c = security(data, period, close)
//Triple EMA
temaLength = input(15, minval=1)
ema1 = ema(c, temaLength)
ema2 = ema(ema1, temaLength)
ema3 = ema(ema2, temaLength)
tema = 3 * (ema1 - ema2) + ema3
//Moving Average
smaLength = input(7, minval=1)
sma = sma(c, smaLength)
//RSI
src = c
rsiLength = input(4, minval=1, title="Length")
up = rma(max(change(src), 0), rsiLength)
down = rma(-min(change(src), 0), rsiLength)
rsi = down == 0 ? 100 : up == 0 ? 0 : 100 - (100 / (1 + up / down))
rsin= input(9)
sn = 100 - rsin
ln = 0 + rsin
//Strategy
gc = c > o ? 1 : 0
rc = c < o ? 1 : 0
long = crossover(tema[2], sma[2]) and gc[1] == 1 and gc == 1 and rsi > sn
short = crossunder(tema[2], sma[2]) and rc[1] == 1 and rc == 1 and rsi < ln
plot(long, "long", color=green)
plot(short, "short", color=red)
註釋
The above alert script did not copy/paste properly and is getting an error, to avoid clutter, just replace the bottom section @ //Strategy//Strategy
gc = c > o ? 1 : 0
rc = c < o ? 1 : 0
long = crossover(tema[2], sma[2]) and gc[1] == 1 and gc == 1 and rsi > sn
short = crossunder(tema[2], sma[2]) and rc[1] == 1 and rc == 1 and rsi < ln
plot(long, "long", color=green)
plot(short, "short", color=red)
註釋
Let's try this again...//Strategy
gc = c > o ? 1 : 0
rc = c < o ? 1 : 0
long = crossover(tema[2], sma[2]) and gc[1] == 1 and gc == 1 and rsi > sn
short = crossunder(tema[2], sma[2]) and rc[1] == 1 and rc == 1 and rsi < ln
plot(long, "long", color=green)
plot(short, "short", color=red)
註釋
Apologies for all the updates, not sure why pasting that section in here becomes corrupt, so instead I simply published the alert script here:
註釋
All orders are now being tracked in a Google Sheet for public viewing. Since: 08/12/2014 07:00:00
Net Profit = $644.58 in BTC value
Link for tracked statistics here:
bit.ly/1SMvGVu
註釋
To avoid repainting, this code needs to be adjusted. Results actually improve once the issue is corrected.On line 11 - 14 you'll see this...
o = security(data, period, open)
h = security(data, period, high)
l = security(data, period, low)
c = security(data, period, close)
we need to actually use the previous candle to avoid repainting, so just add a 1 candle look back.
square brackets 1 after the words "open, high, low, close"
TV does not let me paste the brackets, but you can see on line 12-16 of this strategy here what is needed.
![[AutoView] Automate it -Heiken Ashi, No pyramiding or repainting](https://s3.tradingview.com/w/wEZWjpGY_mid.png)
Hope this makes sense. Good luck.
發行說明
Updated to Pinescript version 3 and added the new standard components.開源腳本
秉持TradingView一貫精神,這個腳本的創作者將其設為開源,以便交易者檢視並驗證其功能。向作者致敬!您可以免費使用此腳本,但請注意,重新發佈代碼需遵守我們的社群規範。
免責聲明
這些資訊和出版物並非旨在提供,也不構成TradingView提供或認可的任何形式的財務、投資、交易或其他類型的建議或推薦。請閱讀使用條款以了解更多資訊。
免責聲明
這些資訊和出版物並非旨在提供,也不構成TradingView提供或認可的任何形式的財務、投資、交易或其他類型的建議或推薦。請閱讀使用條款以了解更多資訊。