OPEN-SOURCE SCRIPT
RSI W Pattern strategy
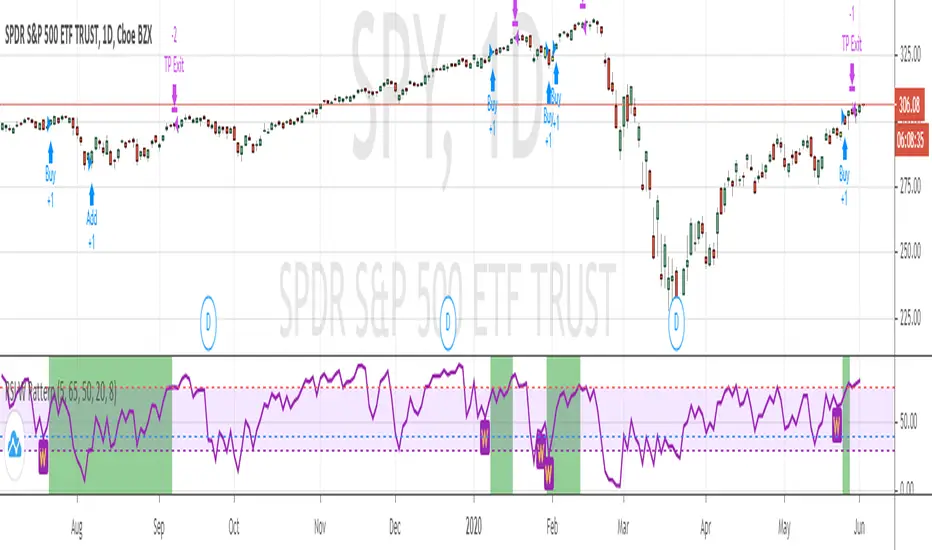
This strategy is similar to RSI V pattern strategy, but it looks for W pattern in RSI chart.
RULES
======
BUY
1. ema20 is above ema50
2. RSI5 crossing up 30 from oversold area
3. and RSI5 must be below overbought area (default value set to 65)
Add to existing Position
1. You can add on the next W pattern OR
2. if RSI5 is crossing up from below 20
Exit
1. when RSI5 reaches 75
Note: This is for short term/swing trading . which gets on when price dip in trending and quickly gets you out on RSI overbought area
開源腳本
秉持TradingView一貫精神,這個腳本的創作者將其設為開源,以便交易者檢視並驗證其功能。向作者致敬!您可以免費使用此腳本,但請注意,重新發佈代碼需遵守我們的社群規範。
免責聲明
這些資訊和出版物並非旨在提供,也不構成TradingView提供或認可的任何形式的財務、投資、交易或其他類型的建議或推薦。請閱讀使用條款以了解更多資訊。
免責聲明
這些資訊和出版物並非旨在提供,也不構成TradingView提供或認可的任何形式的財務、投資、交易或其他類型的建議或推薦。請閱讀使用條款以了解更多資訊。