OPEN-SOURCE SCRIPT
已更新 Open Price Regression Model
nput Variables: The user can adjust the lookbackPeriod and m (multiplier) inputs. The lookbackPeriod specifies the number of previous bars used for regression calculations, and m is used to calculate the confidence interval width.
Calculate Regression Model: The code extracts open, high, low, and close prices for the current candle. It then performs regression calculations for high, low, and close prices based on the open prices.
Calculate Predicted Prices: Using the regression coefficients and intercepts, the code calculates predicted high, low, and close prices based on the current open price.
Calculate Confidence Interval: The code computes the standard errors of the regression for high, low, and close prices and multiplies them by the specified confidence level multiplier (m) to determine the width of the confidence intervals.
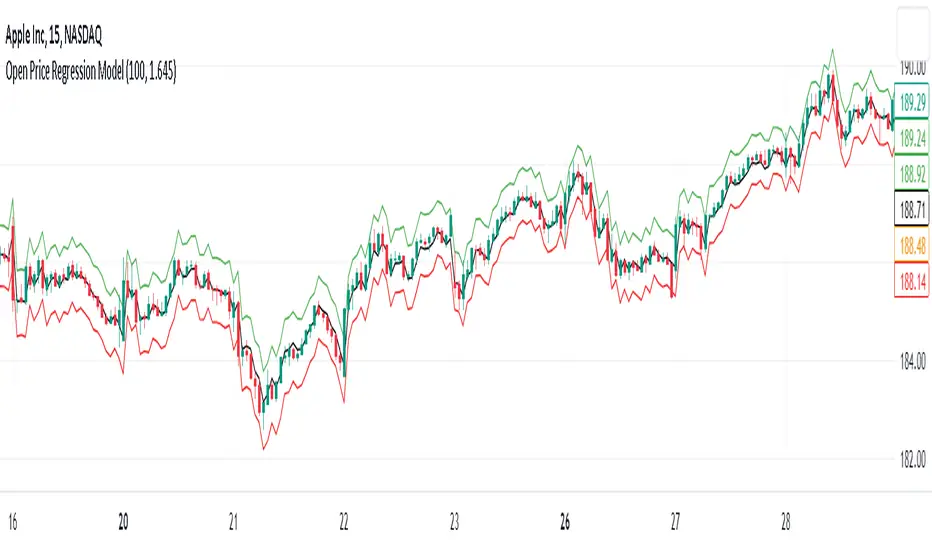
Plotting: The predicted high, low, and close prices are plotted with different colors. Additionally, confidence intervals are plotted around the predicted prices using lines.
Implications and Trading Advantage:
The Open Price Regression Model aims to predict future high, low, and close prices based on the current open price. Traders can use the predicted values and confidence intervals as potential price targets and volatility measures. Traders can consider taking long or short positions based on whether the current open price is below or above the predicted prices. Can be used on a daily time frame to forecast the day's high and low and use this levels are horizontal price levels on lower timeframes.
Calculate Regression Model: The code extracts open, high, low, and close prices for the current candle. It then performs regression calculations for high, low, and close prices based on the open prices.
Calculate Predicted Prices: Using the regression coefficients and intercepts, the code calculates predicted high, low, and close prices based on the current open price.
Calculate Confidence Interval: The code computes the standard errors of the regression for high, low, and close prices and multiplies them by the specified confidence level multiplier (m) to determine the width of the confidence intervals.
Plotting: The predicted high, low, and close prices are plotted with different colors. Additionally, confidence intervals are plotted around the predicted prices using lines.
Implications and Trading Advantage:
The Open Price Regression Model aims to predict future high, low, and close prices based on the current open price. Traders can use the predicted values and confidence intervals as potential price targets and volatility measures. Traders can consider taking long or short positions based on whether the current open price is below or above the predicted prices. Can be used on a daily time frame to forecast the day's high and low and use this levels are horizontal price levels on lower timeframes.
發行說明
Used on line chart for displaying actual price (blue line) instead on candles. The 1.282 multiplier is for 80% confidence interval (narrow band), 1.645 for 90% confidence interval and 1.960 for 95% confidence interval and 2.170 for 97% confidence interval (wider band) https://www.tradingview.com/chart/n4nTsEOA/發行說明
minor change 發行說明
core changes to the code how it performs the regression 發行說明
updated code and simplified 開源腳本
秉持TradingView一貫精神,這個腳本的創作者將其設為開源,以便交易者檢視並驗證其功能。向作者致敬!您可以免費使用此腳本,但請注意,重新發佈代碼需遵守我們的社群規範。
免責聲明
這些資訊和出版物並非旨在提供,也不構成TradingView提供或認可的任何形式的財務、投資、交易或其他類型的建議或推薦。請閱讀使用條款以了解更多資訊。
開源腳本
秉持TradingView一貫精神,這個腳本的創作者將其設為開源,以便交易者檢視並驗證其功能。向作者致敬!您可以免費使用此腳本,但請注意,重新發佈代碼需遵守我們的社群規範。
免責聲明
這些資訊和出版物並非旨在提供,也不構成TradingView提供或認可的任何形式的財務、投資、交易或其他類型的建議或推薦。請閱讀使用條款以了解更多資訊。