OPEN-SOURCE SCRIPT
已更新 Seri Indicator 0.1
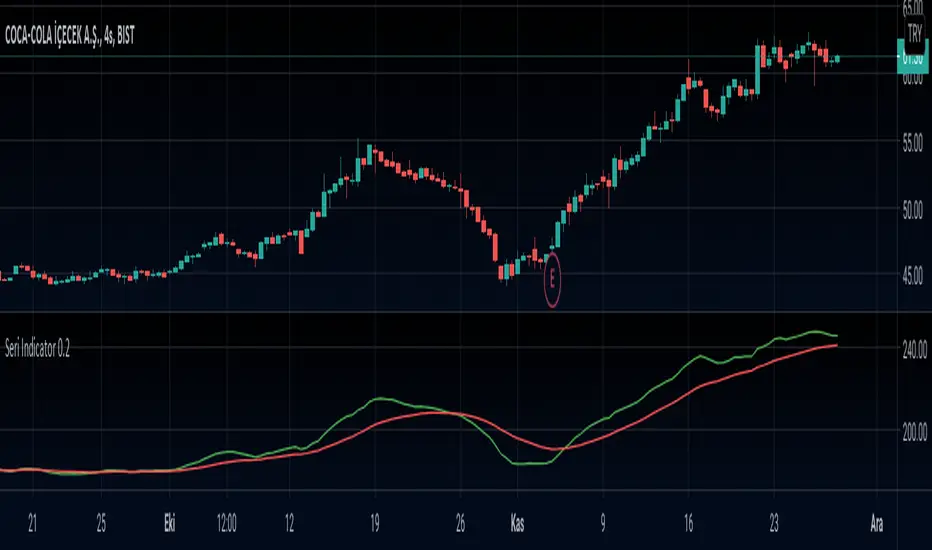
This is a Moving Average based indicator that is inspired by the MACD indicator. The indicator is intended to indicate trend reversals, and works best in hourly charts (1h-2h-3h-4h).
The Seri Indicator is easy to interpret, which was one of the design goals. If the Fast Moving Average (Green Line) crosses ABOVE the Slow Moving Average (Red Line), it indicates a BULLISH Trend, therefore a BUY SIGNAL. If the Fast Moving Average (Green Line) crosses BELOW the Slow Moving Average (Red Line), it indicates a BEARISH trend, therefore a SELL SIGNAL. The indicator is in development phase so it is natural for it to give faulty signals, so it is good practice to use it on a longer-term chart than the intended one (Use 2h chart for hourly trades etc.).
Any suggestions for improvements are highly welcome!
發行說明
This is a Moving Average based indicator that is inspired by the MACD indicator. The indicator is intended to indicate trend reversals, and works best in hourly charts (1h-2h-3h-4h).The Seri Indicator is easy to interpret, which was one of the design goals. If the Fast Moving Average (Green Line) crosses ABOVE the Slow Moving Average (Red Line), it indicates a BULLISH Trend, therefore a BUY SIGNAL. If the Fast Moving Average (Green Line) crosses BELOW the Slow Moving Average (Red Line), it indicates a BEARISH trend, therefore a SELL SIGNAL. The indicator is in development phase so it is natural for it to give faulty signals, so it is good practice to use it on a longer-term chart than the intended one (Use 2h chart for hourly trades etc.).
The current version is 0.2. The indicator is still in alpha/testing phase therefore is not market-ready for big amounts of investment.
Any suggestions for improvements are highly welcome!
開源腳本
秉持TradingView一貫精神,這個腳本的創作者將其設為開源,以便交易者檢視並驗證其功能。向作者致敬!您可以免費使用此腳本,但請注意,重新發佈代碼需遵守我們的社群規範。
免責聲明
這些資訊和出版物並非旨在提供,也不構成TradingView提供或認可的任何形式的財務、投資、交易或其他類型的建議或推薦。請閱讀使用條款以了解更多資訊。
開源腳本
秉持TradingView一貫精神,這個腳本的創作者將其設為開源,以便交易者檢視並驗證其功能。向作者致敬!您可以免費使用此腳本,但請注意,重新發佈代碼需遵守我們的社群規範。
免責聲明
這些資訊和出版物並非旨在提供,也不構成TradingView提供或認可的任何形式的財務、投資、交易或其他類型的建議或推薦。請閱讀使用條款以了解更多資訊。