INVITE-ONLY SCRIPT
Fibonacci Bands
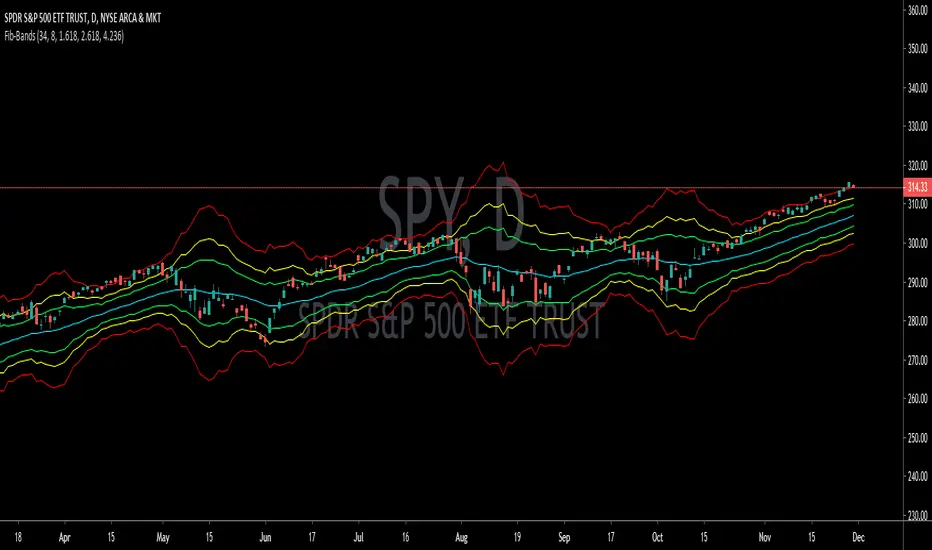
Fibonacci Bands are derived from Fibonacci ratios expansion from a fixed moving average.
These bands help traders find key areas of support and resistance . "Fibonacci bands" are
computed by adding a Fibonacci ratio distance (Up and Down) from a "key moving" average
(21, 34, 89 periods). An 8 period average of "True range" is computed. The multiples of
Fibonacci ratios of this range are added to the fixed moving average to compute Fibonacci
Bands
One of the best ways to find trend reversals is to watch the price action near the extreme bands
(both lower and higher). Markets tend to reverse when prices trade outside of the band for a
few bars and again trade inside the bands. After reversals, markets also tend to trade from one
extreme band to the other end (opposite) of the extreme bands.
僅限邀請腳本
僅限作者授權的用戶訪問此腳本,並且通常需要付費。您可以將其增加到收藏腳本中,但是只有在向作者請求並獲得許可之後,才能使用它。 請聯繫DarkSideTrader以了解更多信息,或按照下面作者的說明進行操作。
TradingView 不建議購買並使用此腳本,除非您 100% 信任其作者並了解腳本的工作原理。在許多情況下,您可以在我們的社群腳本中免費找到良好的開源替代方案。
作者的說明
″
想在圖表上使用此腳本?
警告:請閱讀,然後再請求訪問權限。
Follow us
Twitter twitter.com/darksidetrader
YouTube youtube.com/channel/UCAR8aMbticG9ePJrxeZ8mjw
Join Chat Room discord.gg/N4HSqJN96X
Website tradersofwallst.com
Live
9:00 AM EST to 2:30 PM EST
Twitter twitter.com/darksidetrader
YouTube youtube.com/channel/UCAR8aMbticG9ePJrxeZ8mjw
Join Chat Room discord.gg/N4HSqJN96X
Website tradersofwallst.com
Live
9:00 AM EST to 2:30 PM EST
免責聲明
這些資訊和出版物並不意味著也不構成TradingView提供或認可的金融、投資、交易或其他類型的意見或建議。請在使用條款閱讀更多資訊。