OPEN-SOURCE SCRIPT
已更新 StonkGame AutoLevels+
Hey gang — made a new levels script to automatically plot the ones I use the most.
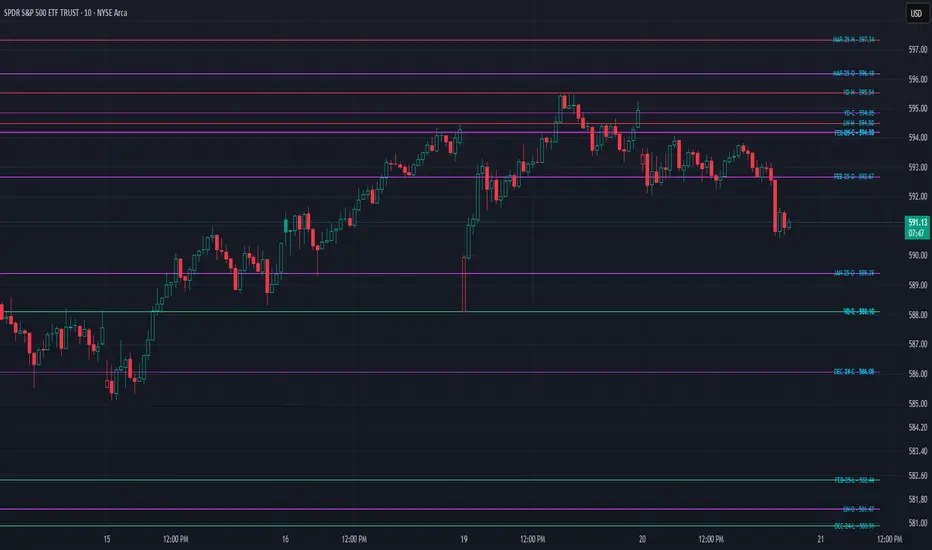
StonkGame AutoLevels+ automatically plots structural price levels from major timeframes — including Yesterday, Last Week, Last Month, Last Quarter, and Last Year — with the option to include up to 6 months of historical monthly open, high, low, and close levels.
Everything’s fully customizable. You pick which timeframes to show, which price types (O/H/L/C) matter, and where the labels appear. Highs are red, lows are lime. Monthly opens are fuchsia, closes are purple — easy to separate at a glance.
Labels auto-stagger to reduce clutter and can be positioned left, right, or center — or turned off completely. You also control how far they sit from price.
The screenshot shows everything turned on just to demo the range — but in practice, I usually stick with the standard levels like Last Week or Last Month, and only show highs and lows (they define structure best IMO).
Clean, contextual, and built for traders who want clarity without noise.
發行說明
Fixed the monthly label logic to ensure accurate month and year tags for each OHLC level. The previous method used an offset-based approach that could mismatch the actual month, especially on intraday charts, leading to incorrect labels like showing "APR-24" when it was actually May. The update now pulls the exact timestamp from each monthly bar and derives the label directly from that, so labels always reflect the correct calendar month associated with the price levels.發行說明
Update #2: some further bug fixes for labels, and input layout changes to make it more intuitive,ordered.發行說明
Removed the static timeframe options for last month and last quarter, as it was redundant with the 6 monthly lookback levels and could cause clutter and was just extra code. Also changed some default cosmetic settings to what I think is most helpful visually. 開源腳本
秉持TradingView一貫精神,這個腳本的創作者將其設為開源,以便交易者檢視並驗證其功能。向作者致敬!您可以免費使用此腳本,但請注意,重新發佈代碼需遵守我們的社群規範。
免責聲明
這些資訊和出版物並非旨在提供,也不構成TradingView提供或認可的任何形式的財務、投資、交易或其他類型的建議或推薦。請閱讀使用條款以了解更多資訊。
免責聲明
這些資訊和出版物並非旨在提供,也不構成TradingView提供或認可的任何形式的財務、投資、交易或其他類型的建議或推薦。請閱讀使用條款以了解更多資訊。