OPEN-SOURCE SCRIPT
已更新 WonderTrend Indicator
Determining trends and reversals are the keys to trading, yet very difficult. Parabolic SAR is hard to trade during choppy price action. SuperTrend is a bit late in determining changes of trend and not great and exit signals.
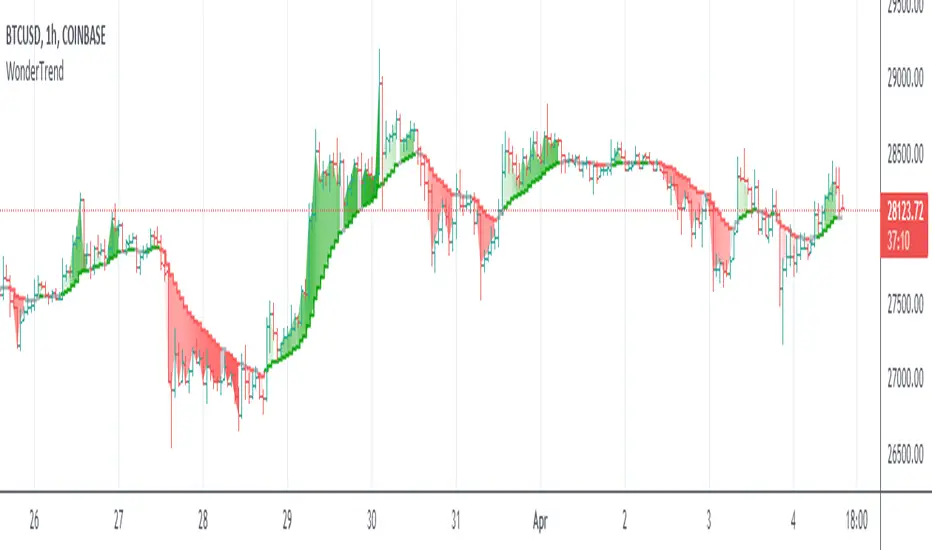
So WonderTrend is a bit of both, a more stubborn PSAR, also a faster SuperTrend. The green is up, red is down, and yellow is caution helps traders read the chart patterns to enter and exit.
Enjoy!
So WonderTrend is a bit of both, a more stubborn PSAR, also a faster SuperTrend. The green is up, red is down, and yellow is caution helps traders read the chart patterns to enter and exit.
Enjoy!
發行說明
The long-awaited update to WonderTrend. The shading is produced by measuring the gap and the rounding angles. The result shown allows traders to visually "see" the current trend, and avoid dormant price action.
Rules that may be helpful:
1. The beginning of the color segments are good entry points. You'll notice that good trends are color shaded.
2. The best exits depend on your target and psyche :)
3. When there's no shading, it's drifting. The slope acts as a prevailing wind, and may predict the direction for the next color segment.
開源腳本
秉持TradingView一貫精神,這個腳本的創作者將其設為開源,以便交易者檢視並驗證其功能。向作者致敬!您可以免費使用此腳本,但請注意,重新發佈代碼需遵守我們的社群規範。
免責聲明
這些資訊和出版物並非旨在提供,也不構成TradingView提供或認可的任何形式的財務、投資、交易或其他類型的建議或推薦。請閱讀使用條款以了解更多資訊。
開源腳本
秉持TradingView一貫精神,這個腳本的創作者將其設為開源,以便交易者檢視並驗證其功能。向作者致敬!您可以免費使用此腳本,但請注意,重新發佈代碼需遵守我們的社群規範。
免責聲明
這些資訊和出版物並非旨在提供,也不構成TradingView提供或認可的任何形式的財務、投資、交易或其他類型的建議或推薦。請閱讀使用條款以了解更多資訊。