OPEN-SOURCE SCRIPT
Volatility Based Momentum (VBM)
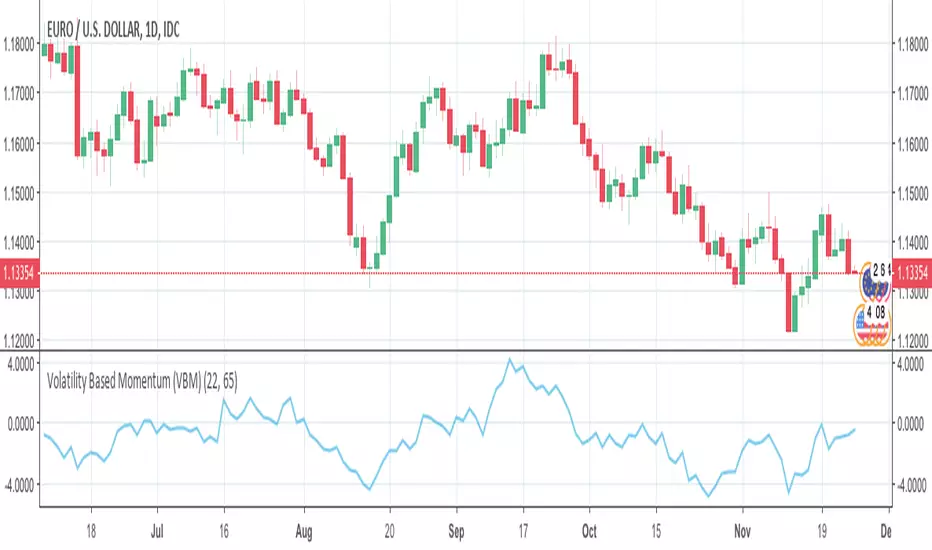
The Volatility Based Momentum (VBM) indicator is a variation on the rate-of-change (ROC) indicator. Instead of expressing momentum in a percentage gain or loss, VBM normalizes momentum using the historical volatility of the underlying security.
The VBM indicator offers numerous benefits to traders who orient their trading around volatility. For these traders, VBM expresses momentum in a normalized, universally applicable ‘multiples of volatility’ (MoV) unit. Given the universal applicability of MoV, VBM is especially suited to traders whose trading incorporates numerous timeframes, different types of securities (e.g., stocks, Forex pairs), or the frequent comparison of momentum between multiple securities.
The calculation for a volatility based momentum (VBM) indicator is very similar to ROC, but divides by the security’s historical volatility instead. The average true range indicator (ATR) is used to compute historical volatility.
VBM(n,v) = (Close - Close n periods ago) / ATR(v periods)
For example, on a daily chart, VBM(22,65) calculates how many MoV price has increased or decreased over the last 22 trading days (approximately one calendar month). The second parameter is the number of periods to use with the ATR indicator to normalize the momentum in terms of volatility.
For more details, there is an article further describing VBM and its applicability versus ROC.
開源腳本
秉持TradingView一貫精神,這個腳本的創作者將其設為開源,以便交易者檢視並驗證其功能。向作者致敬!您可以免費使用此腳本,但請注意,重新發佈代碼需遵守我們的社群規範。
免責聲明
這些資訊和出版物並非旨在提供,也不構成TradingView提供或認可的任何形式的財務、投資、交易或其他類型的建議或推薦。請閱讀使用條款以了解更多資訊。
開源腳本
秉持TradingView一貫精神,這個腳本的創作者將其設為開源,以便交易者檢視並驗證其功能。向作者致敬!您可以免費使用此腳本,但請注意,重新發佈代碼需遵守我們的社群規範。
免責聲明
這些資訊和出版物並非旨在提供,也不構成TradingView提供或認可的任何形式的財務、投資、交易或其他類型的建議或推薦。請閱讀使用條款以了解更多資訊。