OPEN-SOURCE SCRIPT
Candle Rating (1–5)
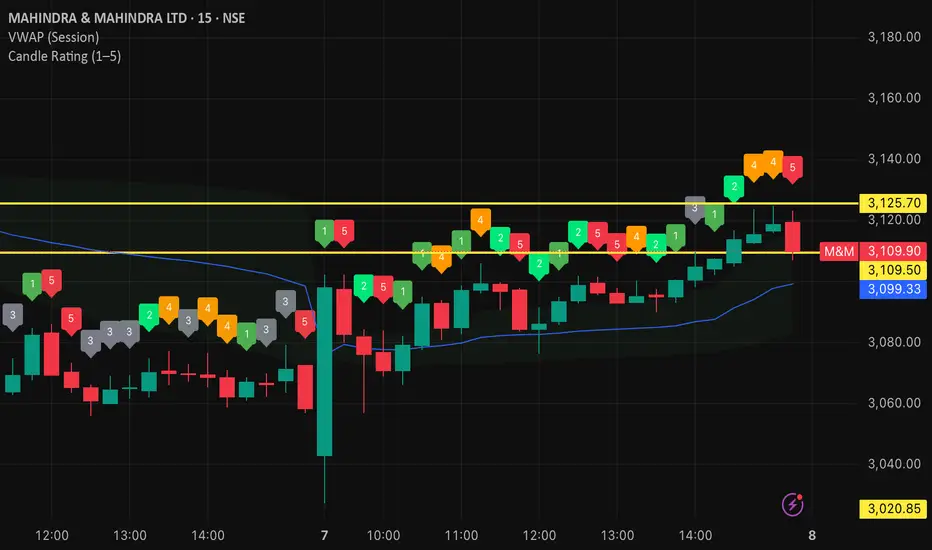
This “Candle Rating (1–5)” indicator measures where each bar’s close sits within its own high-low range and assigns a simple strength score:
Range Calculation
It computes the candle’s total range (high − low) and finds the close’s position as a percentage of that range (0 = close at low, 1 = close at high).
Five-Point Rating
1 (Strong Buy): Close in the top 20% of the range
2 (Moderate Buy): 60–80%
3 (Neutral): 40–60%
4 (Moderate Sell): 20–40%
5 (Strong Sell): Bottom 20%
Visual Feedback
It plots the numeric rating above each bar (colored green → red), giving you an at-a-glance read of candle momentum and potential reversal strength across any timeframe.
開源腳本
秉持TradingView一貫精神,這個腳本的創作者將其設為開源,以便交易者檢視並驗證其功能。向作者致敬!您可以免費使用此腳本,但請注意,重新發佈代碼需遵守我們的社群規範。
免責聲明
這些資訊和出版物並非旨在提供,也不構成TradingView提供或認可的任何形式的財務、投資、交易或其他類型的建議或推薦。請閱讀使用條款以了解更多資訊。
免責聲明
這些資訊和出版物並非旨在提供,也不構成TradingView提供或認可的任何形式的財務、投資、交易或其他類型的建議或推薦。請閱讀使用條款以了解更多資訊。