OPEN-SOURCE SCRIPT
已更新 TKP McClellan Summation Index Stochastics Strategy
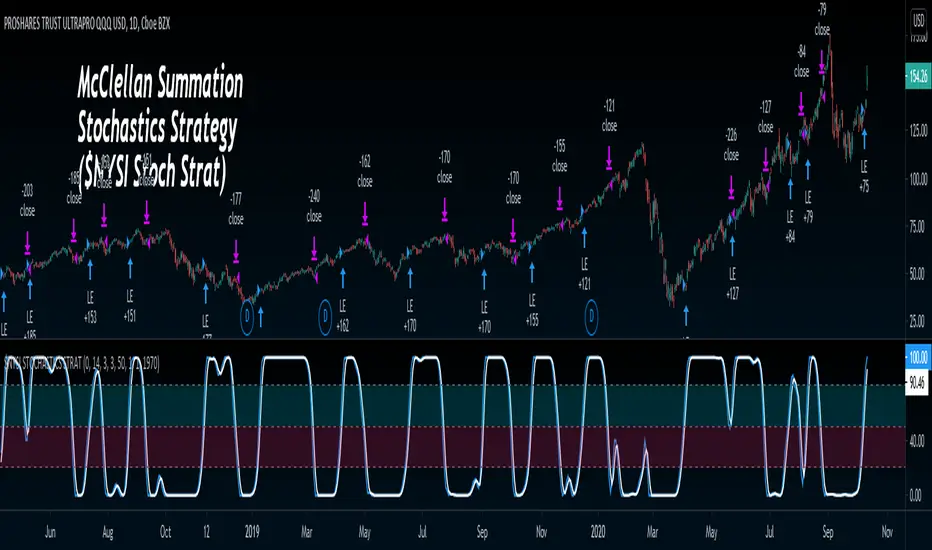
This strategy uses NYSE McClellan summation Index as an input for Stochastics to produce Buy/Sell signals. Buy signal is produced when Stochastics K Line Closes over 50, and Sell signal when closes under 50.
Info on McClellan Summation Index: investopedia.com/terms/m/mcclellansummation.asp
Info on Stochastics: investopedia.com/articles/technical/073001.asp
Simple yet effective strategy, let me know if you have any questions!
Info on McClellan Summation Index: investopedia.com/terms/m/mcclellansummation.asp
Info on Stochastics: investopedia.com/articles/technical/073001.asp
Simple yet effective strategy, let me know if you have any questions!
發行說明
I've added two things in this update. 1. Time stamp so you can now back-test from a different start date... for example, since 2019, the strategy is 90% profitable on $TQQQ.
2. I added the ability to change the threshold on Buy/Sell crossover level.
開源腳本
秉持TradingView一貫精神,這個腳本的創作者將其設為開源,以便交易者檢視並驗證其功能。向作者致敬!您可以免費使用此腳本,但請注意,重新發佈代碼需遵守我們的社群規範。
免責聲明
這些資訊和出版物並非旨在提供,也不構成TradingView提供或認可的任何形式的財務、投資、交易或其他類型的建議或推薦。請閱讀使用條款以了解更多資訊。
開源腳本
秉持TradingView一貫精神,這個腳本的創作者將其設為開源,以便交易者檢視並驗證其功能。向作者致敬!您可以免費使用此腳本,但請注意,重新發佈代碼需遵守我們的社群規範。
免責聲明
這些資訊和出版物並非旨在提供,也不構成TradingView提供或認可的任何形式的財務、投資、交易或其他類型的建議或推薦。請閱讀使用條款以了解更多資訊。