OPEN-SOURCE SCRIPT
Modified Fractal Open/Close
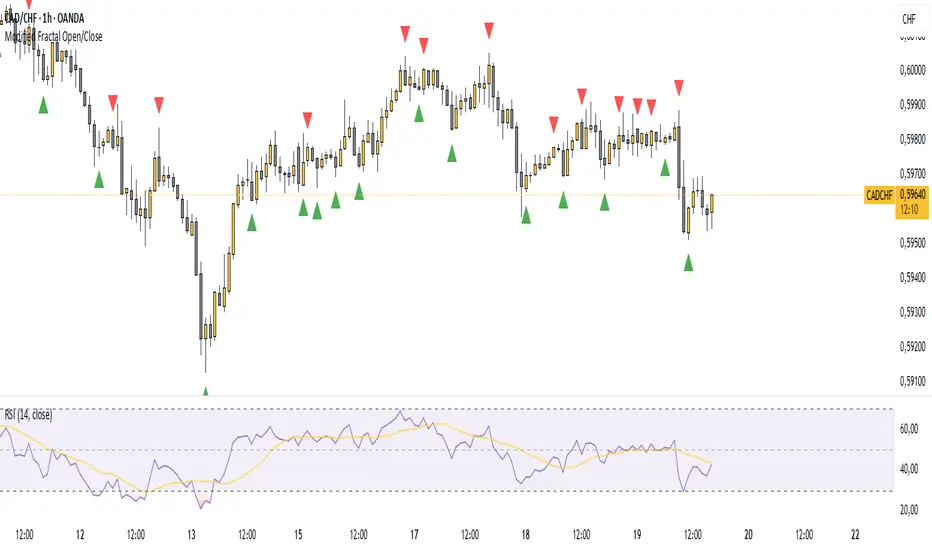
Modified Fractal (Open/Close Based) - Indicator
The Modified Fractal (Open/Close Based) indicator offers a new way to detect fractal patterns on your chart by analyzing the open and close prices instead of the traditional high and low values.
🧮 How it works:
The indicator evaluates a group of 5 consecutive candles.
The central candle (2 bars ago) is analyzed.
For a Bullish Fractal:
The open or close of the central candle must be lower than the open and close of the other 4 surrounding candles.
For a Bearish Fractal:
The open or close of the central candle must be higher than the open and close of the other 4 surrounding candles.
Once a valid pattern is detected, a visual symbol (triangle) is plotted directly on the chart and an alert can be triggered.
✅ Key Features:
Non-repainting signals (evaluated after candle close)
Fully mechanical detection logic
Easy-to-use visual signals
Alert conditions ready to be integrated into TradingView’s alert system
Suitable for multiple timeframes (can be used from M1 to Daily and beyond)
🎯 Use case:
This modified fractal approach can help traders:
Spot potential swing points
Identify possible reversals
Confirm price exhaustion zones
Support breakout or mean reversion strategies
⚠ Note:
This indicator does not provide trade signals by itself. It is recommended to be combined with additional tools, price action analysis, or risk management rules.
開源腳本
秉持TradingView一貫精神,這個腳本的創作者將其設為開源,以便交易者檢視並驗證其功能。向作者致敬!您可以免費使用此腳本,但請注意,重新發佈代碼需遵守我們的社群規範。
免責聲明
這些資訊和出版物並非旨在提供,也不構成TradingView提供或認可的任何形式的財務、投資、交易或其他類型的建議或推薦。請閱讀使用條款以了解更多資訊。
開源腳本
秉持TradingView一貫精神,這個腳本的創作者將其設為開源,以便交易者檢視並驗證其功能。向作者致敬!您可以免費使用此腳本,但請注意,重新發佈代碼需遵守我們的社群規範。
免責聲明
這些資訊和出版物並非旨在提供,也不構成TradingView提供或認可的任何形式的財務、投資、交易或其他類型的建議或推薦。請閱讀使用條款以了解更多資訊。