OPEN-SOURCE SCRIPT
BTC top bottom weekly bands
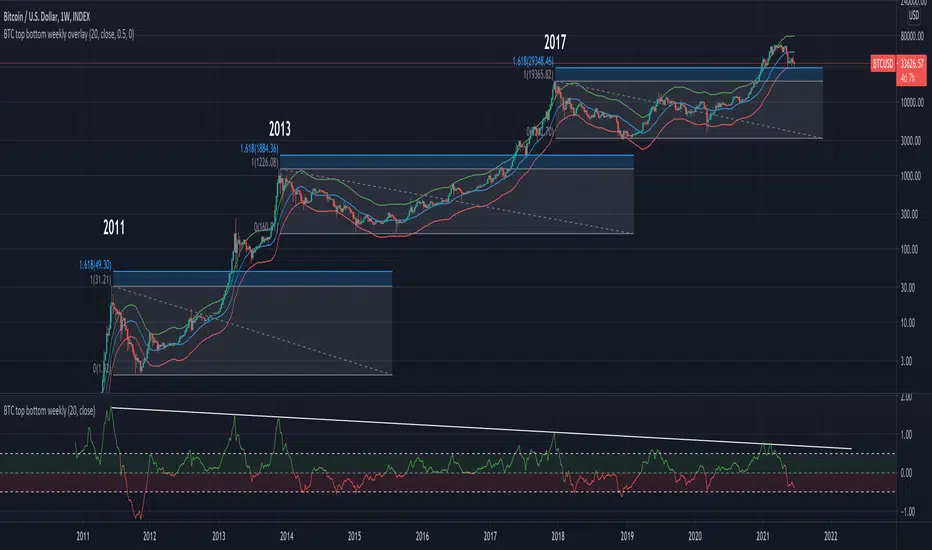
This indicator is based on the 20 weekly simple moving average and it could be used to help finding potential tops and bottoms on a weekly BTC chart.
When using the provided "coef" parameter set to the default of 0.5 it shows how most bottoms since 2013 have hit the lower band of this indicator.
The lower band is calculated as exp(coef) * sma(close)
Instructions:
- Use with the symbol INDEX:BTCUSD so you can see the price since 2010
- Set the timeframe to weekly
- Use logarithmic chart (toggle "log" on)
Optionals:
- change the coef to 0.6 for a more conservative bottom
- change the coef to 0.4 for a more conservative top
開源腳本
秉持TradingView一貫精神,這個腳本的創作者將其設為開源,以便交易者檢視並驗證其功能。向作者致敬!您可以免費使用此腳本,但請注意,重新發佈代碼需遵守我們的社群規範。
Join our membership to gain access to the private scripts.
patreon.com/c/thetradingparrot
patreon.com/c/thetradingparrot
免責聲明
這些資訊和出版物並非旨在提供,也不構成TradingView提供或認可的任何形式的財務、投資、交易或其他類型的建議或推薦。請閱讀使用條款以了解更多資訊。
開源腳本
秉持TradingView一貫精神,這個腳本的創作者將其設為開源,以便交易者檢視並驗證其功能。向作者致敬!您可以免費使用此腳本,但請注意,重新發佈代碼需遵守我們的社群規範。
Join our membership to gain access to the private scripts.
patreon.com/c/thetradingparrot
patreon.com/c/thetradingparrot
免責聲明
這些資訊和出版物並非旨在提供,也不構成TradingView提供或認可的任何形式的財務、投資、交易或其他類型的建議或推薦。請閱讀使用條款以了解更多資訊。