OPEN-SOURCE SCRIPT
已更新 Relative Strength
Description:
This indicator provides a simplified yet powerful method for measuring a stock's momentum based on its proximity to its recent high. It is a direct implementation of a trading concept discussed in a lecture from the New York Institute of Finance.
Core Concept
The underlying theory, supported by academic research, is that a stock making a new high is one of the most bullish signals possible. Such stocks have a statistical tendency to continue making new highs in the near term.
Instead of requiring complex relative strength calculations against a universe of stocks, this indicator uses a simple and elegant ratio to act as a proxy for momentum:
Indicator Value = Current Close / Highest High of Lookback Period
A value approaching 1.0 indicates the stock is strong and nearing a new high. A value at 1.0 means a new high has just been made.
How to Use This Indicator
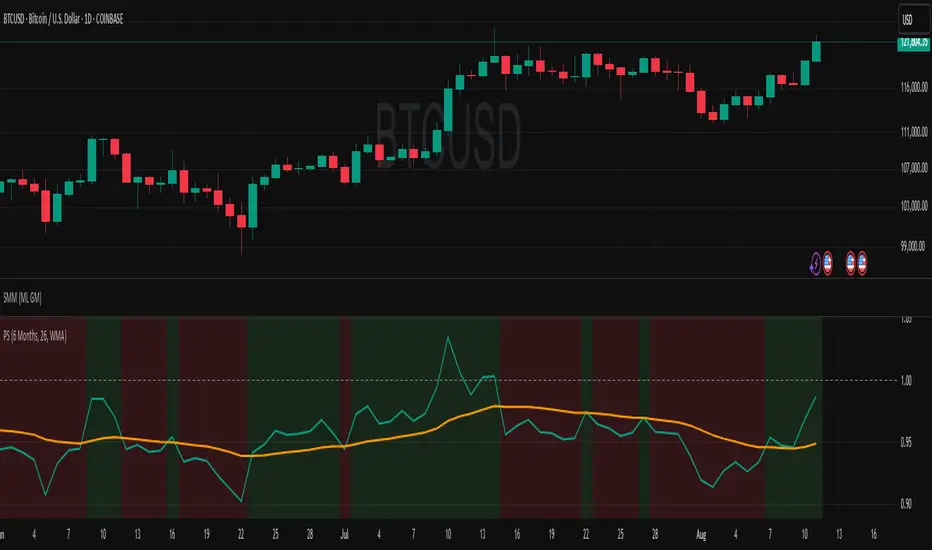
The indicator consists of two primary components:
RS Line (Teal): The core momentum calculation (Close / High).
Signal MA (Orange): A moving average of the NHRS Line, which acts as the trigger for signals.
The signals are generated based on the crossover between these two lines:
BUY Signal: When the RS Line crosses ABOVE its moving average. This suggests that short-term momentum is accelerating and a new uptrend may be starting. The background will turn green.
SELL Signal: When the RS Line crosses BELOW its moving average. This indicates that momentum is fading and it may be prudent to exit the position to avoid a decline. The background will turn red.
Indicator Settings
You can customize the indicator to fit your trading style and the timeframe you are analyzing:
High Lookback Period: Choose the period for the "Highest High" calculation. Options range from 1 Month to 12 Months (52 weeks), allowing you to measure short-term or long-term strength.
Moving Average Length: Adjust the length of the signal line's moving average. The lecturer defaults to 26 weeks for a six-month view.
Moving Average Type: Select the type of moving average for the signal line (SMA, EMA, WMA, HMA).
Credits and Inspiration
Proper credit is essential. This script is a practical application of a concept that builds upon foundational academic work.
The core idea that a stock's proximity to its 52-week high is an investable anomaly was detailed in the 2004 Journal of Finance paper:
"The 52 Week High and Momentum Investing" by Thomas J. George and Chuan-Yang Hwang.
The lecturer's contribution, which this script implements, was to simplify this concept into an actionable trading tool by applying a moving average crossover to generate clear and objective buy and sell signals.
Disclaimer: This tool is for educational and informational purposes only. It is not financial advice. All trading involves risk, and you should always perform your own research and backtesting before making any trading decisions.
This indicator provides a simplified yet powerful method for measuring a stock's momentum based on its proximity to its recent high. It is a direct implementation of a trading concept discussed in a lecture from the New York Institute of Finance.
Core Concept
The underlying theory, supported by academic research, is that a stock making a new high is one of the most bullish signals possible. Such stocks have a statistical tendency to continue making new highs in the near term.
Instead of requiring complex relative strength calculations against a universe of stocks, this indicator uses a simple and elegant ratio to act as a proxy for momentum:
Indicator Value = Current Close / Highest High of Lookback Period
A value approaching 1.0 indicates the stock is strong and nearing a new high. A value at 1.0 means a new high has just been made.
How to Use This Indicator
The indicator consists of two primary components:
RS Line (Teal): The core momentum calculation (Close / High).
Signal MA (Orange): A moving average of the NHRS Line, which acts as the trigger for signals.
The signals are generated based on the crossover between these two lines:
BUY Signal: When the RS Line crosses ABOVE its moving average. This suggests that short-term momentum is accelerating and a new uptrend may be starting. The background will turn green.
SELL Signal: When the RS Line crosses BELOW its moving average. This indicates that momentum is fading and it may be prudent to exit the position to avoid a decline. The background will turn red.
Indicator Settings
You can customize the indicator to fit your trading style and the timeframe you are analyzing:
High Lookback Period: Choose the period for the "Highest High" calculation. Options range from 1 Month to 12 Months (52 weeks), allowing you to measure short-term or long-term strength.
Moving Average Length: Adjust the length of the signal line's moving average. The lecturer defaults to 26 weeks for a six-month view.
Moving Average Type: Select the type of moving average for the signal line (SMA, EMA, WMA, HMA).
Credits and Inspiration
Proper credit is essential. This script is a practical application of a concept that builds upon foundational academic work.
The core idea that a stock's proximity to its 52-week high is an investable anomaly was detailed in the 2004 Journal of Finance paper:
"The 52 Week High and Momentum Investing" by Thomas J. George and Chuan-Yang Hwang.
The lecturer's contribution, which this script implements, was to simplify this concept into an actionable trading tool by applying a moving average crossover to generate clear and objective buy and sell signals.
Disclaimer: This tool is for educational and informational purposes only. It is not financial advice. All trading involves risk, and you should always perform your own research and backtesting before making any trading decisions.
發行說明
Renamed Script for clarityUpgraded to v6
Changed default period to 6 months (previously 12)
Fixed typos
開源腳本
秉持TradingView一貫精神,這個腳本的創作者將其設為開源,以便交易者檢視並驗證其功能。向作者致敬!您可以免費使用此腳本,但請注意,重新發佈代碼需遵守我們的社群規範。
免責聲明
這些資訊和出版物並非旨在提供,也不構成TradingView提供或認可的任何形式的財務、投資、交易或其他類型的建議或推薦。請閱讀使用條款以了解更多資訊。
免責聲明
這些資訊和出版物並非旨在提供,也不構成TradingView提供或認可的任何形式的財務、投資、交易或其他類型的建議或推薦。請閱讀使用條款以了解更多資訊。