OPEN-SOURCE SCRIPT
Percentage MACD Enhanced 3
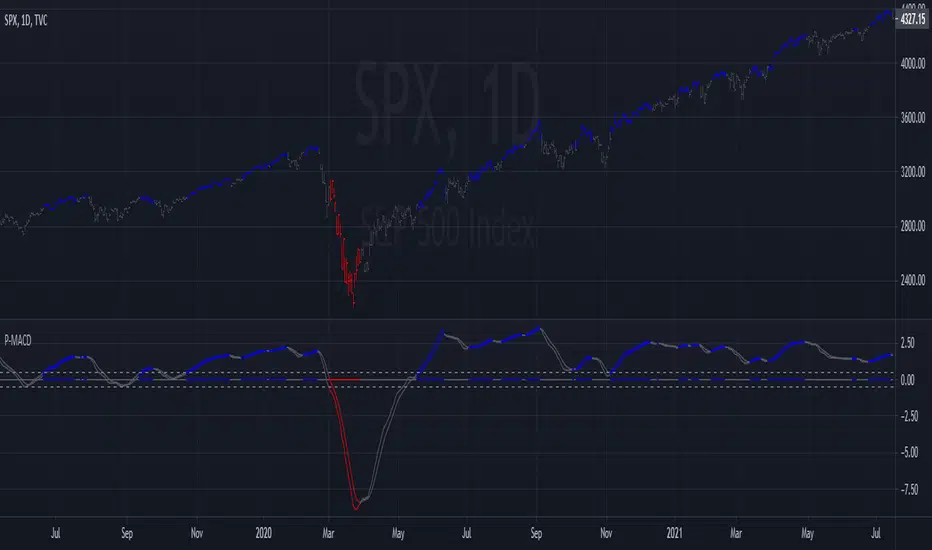
This MACD is calculated using percentage above or below the zero line for consistency and compatibility across different stocks and markets. The price bars are colored when MACD is above/below extreme levels and crossed in that direction. The intention is to use this setting on a longer time frame and trade only in the direction the bars are colored. This setting is also a powerful way to take profits! As usual, my scripts are public for scrutiny and to adjust for your personal needs.
開源腳本
秉持TradingView一貫精神,這個腳本的創作者將其設為開源,以便交易者檢視並驗證其功能。向作者致敬!您可以免費使用此腳本,但請注意,重新發佈代碼需遵守我們的社群規範。
免責聲明
這些資訊和出版物並非旨在提供,也不構成TradingView提供或認可的任何形式的財務、投資、交易或其他類型的建議或推薦。請閱讀使用條款以了解更多資訊。
免責聲明
這些資訊和出版物並非旨在提供,也不構成TradingView提供或認可的任何形式的財務、投資、交易或其他類型的建議或推薦。請閱讀使用條款以了解更多資訊。