OPEN-SOURCE SCRIPT
DZ SR Buy&Sell Enhanced Strategy
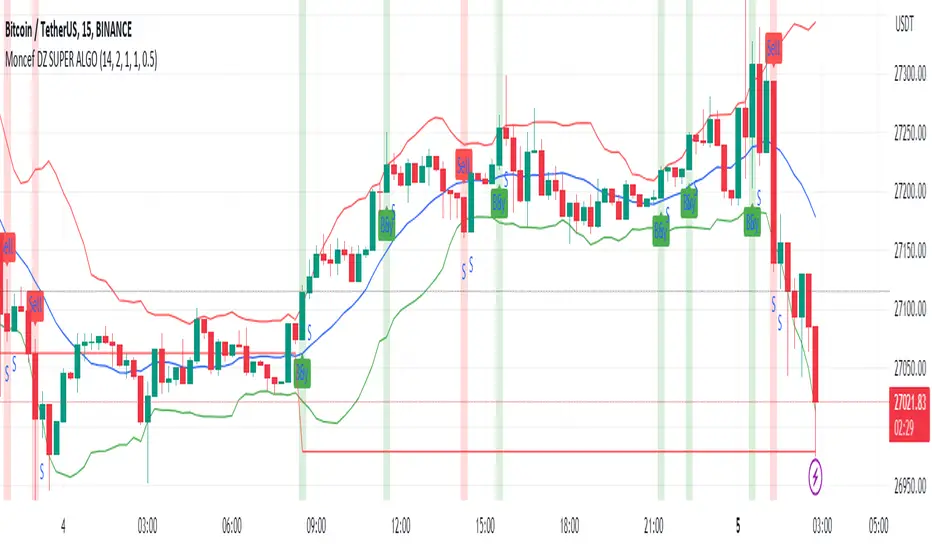
This ALGERIAN indicator titled "SR Buy&Sell with Enhanced Strategy" is designed to identify support and resistance levels on a financial chart, and generates enhanced buy and sell signals based on these levels. It is based on a trading strategy that uses a combination of moving means and standard deviation to calculate support and resistance levels.
The indicator plots support and resistance levels on the chart, with blue color for base level, red for resistance and green for support. Green arrows are displayed when a buy signal is generated, and red arrows when a sell signal is generated.
The market entry strategy is based on breaking support and resistance levels. When a buy signal is generated and no position is opened, a buy position is opened with a take profit and stop loss level calculated according to the parameters set by the user. Similarly, when a sell signal is generated and no position is opened, a sell position is opened with the corresponding take profit and stop loss levels.
The indicator also displays a “STOP” indicator when a position exit signal is generated, indicating to the trader that it is time to close the current position.
This indicator is a powerful tool for traders who want to exploit support and resistance levels to improve their trading decisions. It can be used in different financial markets and different time periods. Parameters such as average moving length, deviations and multiplier can be adjusted according to individual trader preferences.
Note: This indicator only provides potential signals and does not guarantee positive results with every trade. It is recommended to use this indicator in combination with other technical analysis and risk management tools to make informed decisions when trading.
開源腳本
秉持TradingView一貫精神,這個腳本的創作者將其設為開源,以便交易者檢視並驗證其功能。向作者致敬!您可以免費使用此腳本,但請注意,重新發佈代碼需遵守我們的社群規範。
免責聲明
這些資訊和出版物並非旨在提供,也不構成TradingView提供或認可的任何形式的財務、投資、交易或其他類型的建議或推薦。請閱讀使用條款以了解更多資訊。
開源腳本
秉持TradingView一貫精神,這個腳本的創作者將其設為開源,以便交易者檢視並驗證其功能。向作者致敬!您可以免費使用此腳本,但請注意,重新發佈代碼需遵守我們的社群規範。
免責聲明
這些資訊和出版物並非旨在提供,也不構成TradingView提供或認可的任何形式的財務、投資、交易或其他類型的建議或推薦。請閱讀使用條款以了解更多資訊。