OPEN-SOURCE SCRIPT
Date Marker GPT
Date Marker GPT
By Jimmy Dimos (corrected by ChatGPT-o3)
Description
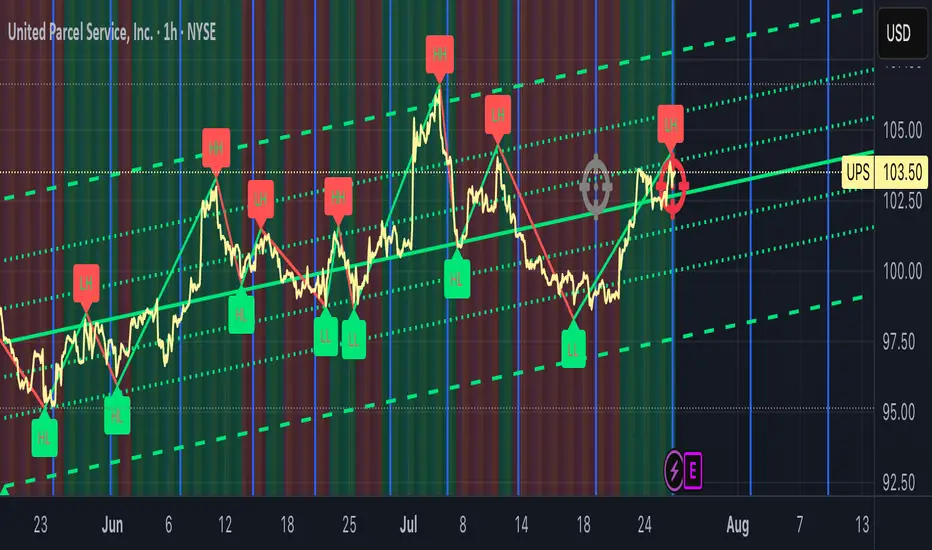
This overlay indicator automatically plots vertical lines at each weekly option-expiration timestamp (Friday at 3 PM CST) for both historical and upcoming periods, helping you visualize key expiration dates alongside your price action and regression tools. Shown is my Date Maker GPT vertical blue Lines, Linear Regression Channel(not part of my script) and zigzag++[LD] also not part of my script.
⸻
Key Features
• Past Expirations: Draws 12 past Friday markers at 3 PM CST
• Future Expirations: Projects 12 upcoming Friday markers at 3 PM CST
• Timezone Handling: Uses UTC internally (21:00 UTC = 3 PM CST)
• Customizable: num_fridays_past and num_fridays_future inputs let you adjust how many weeks to display
⸻
How It Works
1. Timestamp Calculation
• Uses Pine Script’s dayofweek() and timestamp() functions to find each Friday at the target hour.
• Two helper functions, get_previous_friday() and get_next_friday(), compute offsets in days/weeks based on the current bar’s date.
2. Drawing Lines
• Loops through the specified number of weeks in the past and future.
• Calls line.new() for each expiration timestamp, extending lines across the entire chart.
⸻
Usage Tips
• Overlay this script on any OHLC chart to see how price tends to cluster around option expirations.
• Combine with a linear regression or trend-channel indicator to anticipate likely trading ranges leading into expiration.
• Tweak the num_fridays_past and num_fridays_future parameters to focus on shorter or longer horizons.
⸻
Disclaimer: This tool is provided for educational and analytical purposes only. It is not financial advice. Always conduct your own research and risk management.
By Jimmy Dimos (corrected by ChatGPT-o3)
Description
This overlay indicator automatically plots vertical lines at each weekly option-expiration timestamp (Friday at 3 PM CST) for both historical and upcoming periods, helping you visualize key expiration dates alongside your price action and regression tools. Shown is my Date Maker GPT vertical blue Lines, Linear Regression Channel(not part of my script) and zigzag++[LD] also not part of my script.
⸻
Key Features
• Past Expirations: Draws 12 past Friday markers at 3 PM CST
• Future Expirations: Projects 12 upcoming Friday markers at 3 PM CST
• Timezone Handling: Uses UTC internally (21:00 UTC = 3 PM CST)
• Customizable: num_fridays_past and num_fridays_future inputs let you adjust how many weeks to display
⸻
How It Works
1. Timestamp Calculation
• Uses Pine Script’s dayofweek() and timestamp() functions to find each Friday at the target hour.
• Two helper functions, get_previous_friday() and get_next_friday(), compute offsets in days/weeks based on the current bar’s date.
2. Drawing Lines
• Loops through the specified number of weeks in the past and future.
• Calls line.new() for each expiration timestamp, extending lines across the entire chart.
⸻
Usage Tips
• Overlay this script on any OHLC chart to see how price tends to cluster around option expirations.
• Combine with a linear regression or trend-channel indicator to anticipate likely trading ranges leading into expiration.
• Tweak the num_fridays_past and num_fridays_future parameters to focus on shorter or longer horizons.
⸻
Disclaimer: This tool is provided for educational and analytical purposes only. It is not financial advice. Always conduct your own research and risk management.
開源腳本
秉持TradingView一貫精神,這個腳本的創作者將其設為開源,以便交易者檢視並驗證其功能。向作者致敬!您可以免費使用此腳本,但請注意,重新發佈代碼需遵守我們的社群規範。
免責聲明
這些資訊和出版物並非旨在提供,也不構成TradingView提供或認可的任何形式的財務、投資、交易或其他類型的建議或推薦。請閱讀使用條款以了解更多資訊。
開源腳本
秉持TradingView一貫精神,這個腳本的創作者將其設為開源,以便交易者檢視並驗證其功能。向作者致敬!您可以免費使用此腳本,但請注意,重新發佈代碼需遵守我們的社群規範。
免責聲明
這些資訊和出版物並非旨在提供,也不構成TradingView提供或認可的任何形式的財務、投資、交易或其他類型的建議或推薦。請閱讀使用條款以了解更多資訊。