OPEN-SOURCE SCRIPT
💰 Akıllı Para Akışı v4 (Güç Skorlu - Temiz)
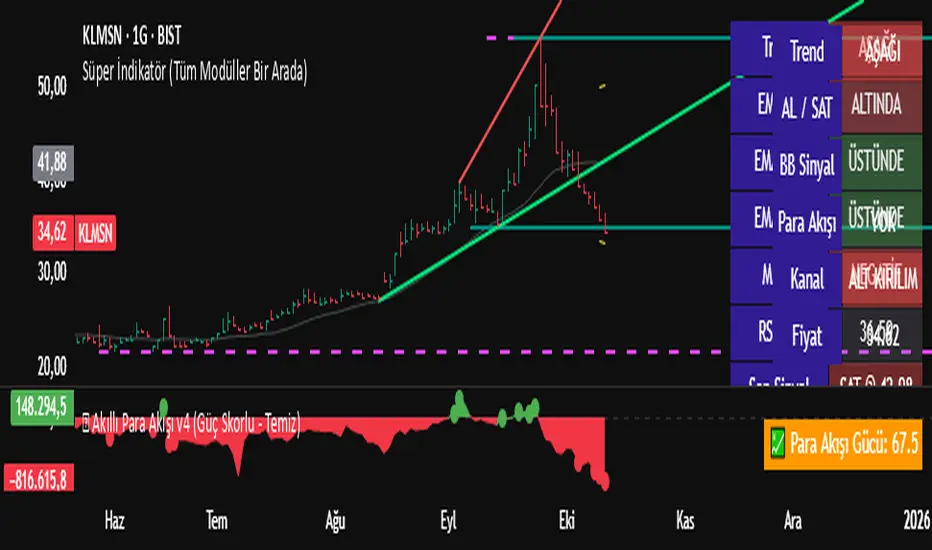
🎨 Nasıl Görünür:
Arka plan sade, alan yumuşak geçişli.
Güçlü sinyaller sadece “ışıklı nokta” olarak belirir.
Sağ alt köşede canlı “Para Akışı Gücü” barı.
Skor: 0–30 kırmızı (zayıf), 30–70 turuncu (nötr), 70–100 yeşil (güçlü).
💰 Smart Money Flow v5 – Concept & Logic
Overview:
The Smart Money Flow v5 indicator combines price action, volume behavior, and momentum strength to detect true money inflows and outflows in the market.
It is designed to help traders identify when institutional (smart) money is entering or leaving an asset, while filtering out noise from normal retail fluctuations.
🔹 Core Logic
Money Flow Calculation:
The core formula is based on the Money Flow Multiplier:
𝑀
𝐹
=
(
𝐶
𝑙
𝑜
𝑠
𝑒
−
𝐿
𝑜
𝑤
)
−
(
𝐻
𝑖
𝑔
ℎ
−
𝐶
𝑙
𝑜
𝑠
𝑒
)
𝐻
𝑖
𝑔
ℎ
−
𝐿
𝑜
𝑤
×
𝑉
𝑜
𝑙
𝑢
𝑚
𝑒
MF=
High−Low
(Close−Low)−(High−Close)
×Volume
This measures how strong the buying or selling pressure is within each bar.
The result is then smoothed with a simple moving average (SMA) to track consistent trends.
RSI & Momentum Filter:
To validate the money flow signals, the indicator combines RSI (Relative Strength Index) and short-term price change (%).
RSI > 50 and price ↑ → confirms positive momentum.
RSI < 50 and price ↓ → confirms negative momentum.
Smart Money Zones:
When both volume and money flow increase in the same direction, it signals a potential Smart Money accumulation or distribution zone:
🟩 Green background → institutional accumulation (buy pressure).
🟥 Red background → institutional distribution (sell pressure).
Flow Trend Line (EMA):
An EMA line of the money flow is plotted to visualize trend direction and strength over time.
This helps identify when money flow momentum is shifting.
Fund Flow Histogram:
Volume-based histogram bars display the actual strength of buying and selling flows.
This gives an immediate visual cue for periods of heavy inflow or outflow.
Strength Score (0–100):
The indicator calculates a “Money Flow Strength Score” based on the relative magnitude of money flow, RSI, and price change:
70–100 → strong inflow (bullish pressure)
30–70 → neutral zone
0–30 → strong outflow (bearish pressure)
Smart Buy/Sell Signals:
🟢 Strong Buy (GÜÇLÜ AL): money inflow + positive RSI + price rising >2%
🔴 Strong Sell (GÜÇLÜ SAT): money outflow + negative RSI + price falling >2%
⚙️ Alerts
Real-time alerts can be configured for:
🚀 Strong Money Inflow (Smart Buy)
⚠️ Strong Money Outflow (Smart Sell)
This allows traders to automate notifications or integrate the signals into Telegram/Discord bots.
🎯 Why It Works
Unlike standard volume indicators, Smart Money Flow v5 focuses on the relationship between price position within the candle and traded volume, giving a more accurate representation of whether large players are entering or exiting positions.
It’s not just about volume — it’s about who controls the price action behind that volume.
開源腳本
本著TradingView的真正精神,此腳本的創建者將其開源,以便交易者可以查看和驗證其功能。向作者致敬!雖然您可以免費使用它,但請記住,重新發佈程式碼必須遵守我們的網站規則。
免責聲明
這些資訊和出版物並不意味著也不構成TradingView提供或認可的金融、投資、交易或其他類型的意見或建議。請在使用條款閱讀更多資訊。
開源腳本
本著TradingView的真正精神,此腳本的創建者將其開源,以便交易者可以查看和驗證其功能。向作者致敬!雖然您可以免費使用它,但請記住,重新發佈程式碼必須遵守我們的網站規則。
免責聲明
這些資訊和出版物並不意味著也不構成TradingView提供或認可的金融、投資、交易或其他類型的意見或建議。請在使用條款閱讀更多資訊。