OPEN-SOURCE SCRIPT
Engulfing Candle Pattern
Indicator Overview
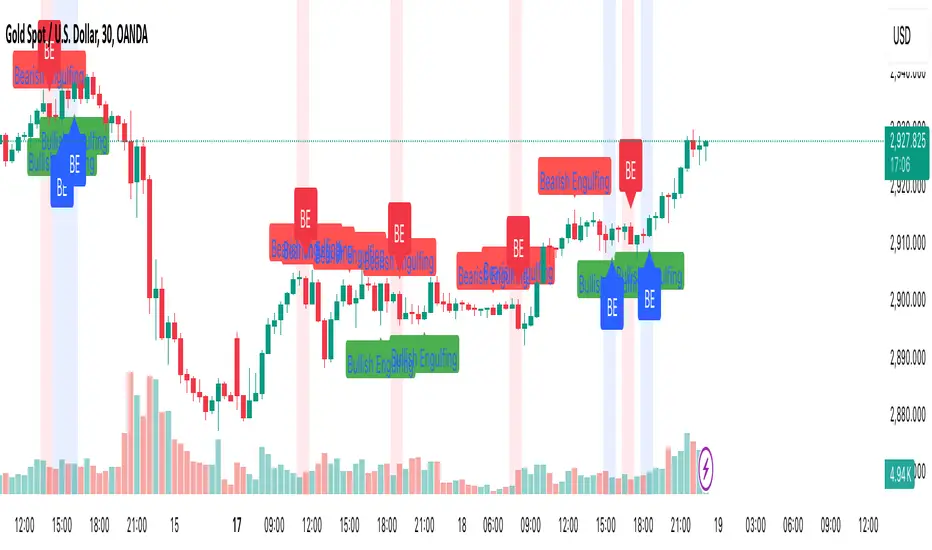
This indicator identifies Bullish and Bearish Engulfing candlestick patterns on a price chart. These patterns are reversal signals:
Key Features
1. Pattern Detection:
2. Visualization:
"Bullish Engulfing" below the candle for bullish patterns.
"Bearish Engulfing" above the candle for bearish patterns.
3. Alerts:
Triggers alerts when either pattern is detected, allowing traders to take action.
How It Works
Bullish Engulfing Condition:
Current candle is bullish (close > open).
Previous candle is bearish (close < open).
Current candle's body fully engulfs the previous candle's body.
Bearish Engulfing Condition:
- Current candle is bearish (close < open).
- Previous candle is bullish (close > open).
- Current candle's body fully engulfs the previous candle's body.
Usage
- Apply the script to any chart in TradingView.
- Look for "Bullish Engulfing" or "Bearish Engulfing" labels on the chart.
- Set up alerts to get notified when these patterns form.
This indicator is a simple yet effective tool for identifying potential trend reversals using engulfing candlestick patterns.
This indicator identifies Bullish and Bearish Engulfing candlestick patterns on a price chart. These patterns are reversal signals:
Key Features
1. Pattern Detection:
2. Visualization:
- Plots labels on the chart:
"Bullish Engulfing" below the candle for bullish patterns.
"Bearish Engulfing" above the candle for bearish patterns.
3. Alerts:
Triggers alerts when either pattern is detected, allowing traders to take action.
How It Works
Bullish Engulfing Condition:
Current candle is bullish (close > open).
Previous candle is bearish (close < open).
Current candle's body fully engulfs the previous candle's body.
Bearish Engulfing Condition:
- Current candle is bearish (close < open).
- Previous candle is bullish (close > open).
- Current candle's body fully engulfs the previous candle's body.
Usage
- Apply the script to any chart in TradingView.
- Look for "Bullish Engulfing" or "Bearish Engulfing" labels on the chart.
- Set up alerts to get notified when these patterns form.
This indicator is a simple yet effective tool for identifying potential trend reversals using engulfing candlestick patterns.
開源腳本
秉持TradingView一貫精神,這個腳本的創作者將其設為開源,以便交易者檢視並驗證其功能。向作者致敬!您可以免費使用此腳本,但請注意,重新發佈代碼需遵守我們的社群規範。
免責聲明
這些資訊和出版物並非旨在提供,也不構成TradingView提供或認可的任何形式的財務、投資、交易或其他類型的建議或推薦。請閱讀使用條款以了解更多資訊。
開源腳本
秉持TradingView一貫精神,這個腳本的創作者將其設為開源,以便交易者檢視並驗證其功能。向作者致敬!您可以免費使用此腳本,但請注意,重新發佈代碼需遵守我們的社群規範。
免責聲明
這些資訊和出版物並非旨在提供,也不構成TradingView提供或認可的任何形式的財務、投資、交易或其他類型的建議或推薦。請閱讀使用條款以了解更多資訊。