OPEN-SOURCE SCRIPT
已更新 Brown's Exponential Smoothing (BES)
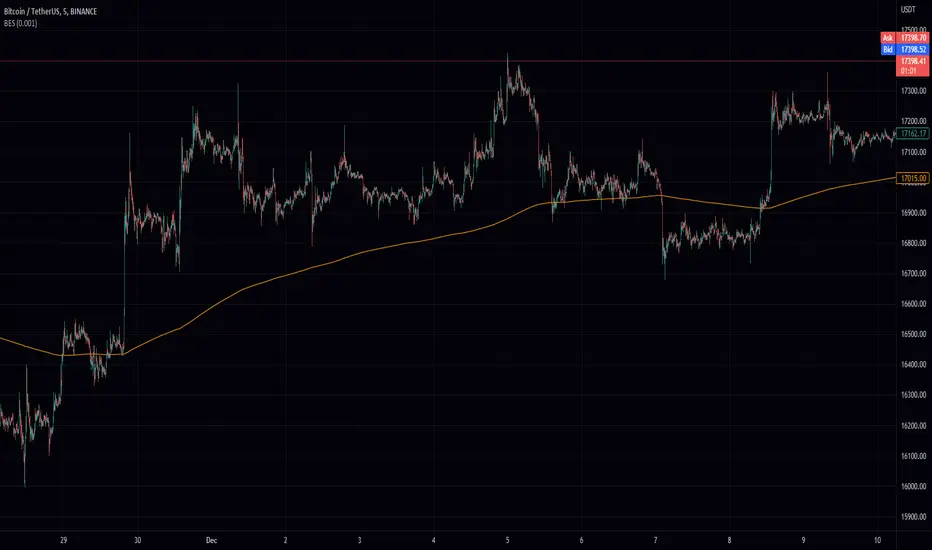
The Brown's Exponential Smoothing indicator is a smoothing function that uses an exponentially weighted moving average to filter the input data. The "alpha" parameter controls the degree of smoothing, with a smaller value resulting in more smoothing and a larger value resulting in less smoothing.
The indicator is implemented as a function, bes, which takes two arguments: source and alpha. The source argument specifies the input data to be smoothed, and the alpha argument specifies the degree of smoothing. The default value for alpha is 0.7, but it can be modified by the user using an input field.
The bes function calculates a smoothed value using the current value of the input data and the previously calculated smoothed value, and updates the value of the smoothed data. This process is repeated for each data point in the input data, resulting in a smoothed version of the data.
The resulting smoothed data is then plotted on the chart using the plot function.
The "BES" indicator can be useful for smoothing noisy or volatile data and making trends in the data more discernible. It may be particularly useful in situations where the input data is highly variable or difficult to interpret due to noise. By adjusting the value of the alpha parameter, the user can control the degree of smoothing applied to the data, allowing them to tailor the indicator to their specific needs and preferences.
發行說明
bug fix發行說明
minor fix開源腳本
秉持TradingView一貫精神,這個腳本的創作者將其設為開源,以便交易者檢視並驗證其功能。向作者致敬!您可以免費使用此腳本,但請注意,重新發佈代碼需遵守我們的社群規範。
免責聲明
這些資訊和出版物並非旨在提供,也不構成TradingView提供或認可的任何形式的財務、投資、交易或其他類型的建議或推薦。請閱讀使用條款以了解更多資訊。
開源腳本
秉持TradingView一貫精神,這個腳本的創作者將其設為開源,以便交易者檢視並驗證其功能。向作者致敬!您可以免費使用此腳本,但請注意,重新發佈代碼需遵守我們的社群規範。
免責聲明
這些資訊和出版物並非旨在提供,也不構成TradingView提供或認可的任何形式的財務、投資、交易或其他類型的建議或推薦。請閱讀使用條款以了解更多資訊。