INVITE-ONLY SCRIPT
Simple VIDYA Smooth | QuantEdgeB
Simple VIDYA Smooth (SVS) | QuantEdgeB
🔍 What Is Simple VIDYA Smooth?
SVS is a smoothed, volatility-adaptive trend filter that blends a Gaussian-pre-filtered, low-lag moving average with dynamic standard-deviation bands. It identifies trends by measuring when price moves decisively above or below a normalized VIDYA (Variable Index Dynamic Average) baseline—filtering out noise and adapting to changing market turbulence.
⚙️ Core Components
1. DEMA Pre-Filter
o A double-EMA smoothing to reduce initial noise before further processing.
2. Gaussian Smoothing
o Applies a small-kernel Gaussian filter to produce a cleaner input series that suppresses rapid spikes.
3. VIDYA Adaptive Average
o Computes a dynamic EMA whose smoothing constant adjusts according to the ratio of short- and long-term standard deviations—making it inherently responsive in volatile times and smooth in calmer periods.
4. Volatility Bands
o Surrounds the VIDYA line with ±N×SD bands (separate multipliers for upper and lower) to capture current market volatility, yielding dynamic thresholds for trend detection.
5. Trend Signal
o Generates a “long” when price closes above the upper band, a “short” when it closes below the lower band, otherwise stays neutral.
💡 Why It’s Special
• Adaptive Responsiveness: VIDYA’s volatility-weighted smoothing constant speeds up trend recognition in choppy markets and slows in quiet ones, avoiding whipsaws.
• Multi-Stage Filtering: The DEMA→Gaussian→VIDYA sequence ensures both rapid noise suppression and flexible trend adaptation.
• Asymmetric Bands: Separate multipliers for the upper and lower volatility bands let you fine-tune sensitivity to bullish versus bearish impulses.
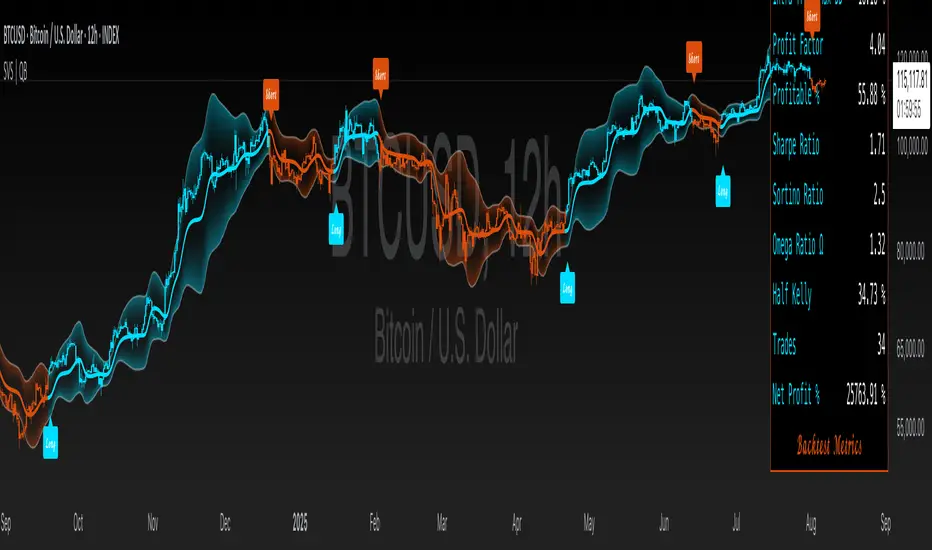
• Visual Clarity: Color-coded candles and filled bands highlight trending phases at a glance, while backtest tables quantify performance.
📊 Backtest Mode
AVBO includes an optional backtest table, enabling traders to assess its historical effectiveness before applying it in live trading conditions.
🔹 Backtest Metrics Displayed:
• Equity Max Drawdown → Largest historical loss from peak equity.
• Profit Factor → Ratio of total profits to total losses, measuring system efficiency.
• Sharpe Ratio → Assesses risk-adjusted return performance.
• Sortino Ratio → Focuses on downside risk-adjusted returns.
• Omega Ratio → Evaluates return consistency & performance asymmetry.
• Half Kelly → Optimal position sizing based on risk/reward analysis.
• Total Trades & Win Rate → Assess historical success rate.
BTC

ETH

📌 Disclaimer:
Backtest results are based on past performance and do not guarantee future success. Always incorporate real-time validation and risk management in live trading.
💼 Ideal Use Cases
• Trend Identification: Pinpoint reliable trend starts and exits in stocks, FX, or crypto—minimizing lag and false breakouts.
• Volatility Regimes: Automatically adjust to quiet vs. explosive markets—no manual parameter tweaks needed.
• Multitimeframe Alignment: Use SVS on multiple timeframes to confirm trend direction before entering positions.
• System Building Block: Embed SVS as a robust, adaptive filter within larger strategies (e.g., to trigger entries or to validate signals from other indicators).
🎨 Default Configuration
• DEMA Length: 7
• Gaussian Kernel: length = 4, sigma = 2.0
• VIDYA Lengths: fast = 9, slow = 24 (or use presets Set1–Set4)
• Volatility Bands: SD length = 40
📌 In Summary
Simple VIDYA Smooth | QuantEdgeB is an adaptive trend-filtering indicator that layers multiple noise-suppressing and volatility-adjusting techniques to deliver clear, reliable trend signals. By marrying DEMA, Gaussian filtering, VIDYA’s volatility-driven smoothing, and dynamic SD bands, SVS excels at separating genuine directional moves from market noise—across any asset or timeframe.
🔹 Disclaimer: Past performance is not indicative of future results. Always backtest and align AVBO’s settings with your risk tolerance and market objectives before live trading.
🔹 Strategic Advice: Always backtest, optimize, and align parameters with your trading objectives and risk tolerance before live trading.
🔍 What Is Simple VIDYA Smooth?
SVS is a smoothed, volatility-adaptive trend filter that blends a Gaussian-pre-filtered, low-lag moving average with dynamic standard-deviation bands. It identifies trends by measuring when price moves decisively above or below a normalized VIDYA (Variable Index Dynamic Average) baseline—filtering out noise and adapting to changing market turbulence.
⚙️ Core Components
1. DEMA Pre-Filter
o A double-EMA smoothing to reduce initial noise before further processing.
2. Gaussian Smoothing
o Applies a small-kernel Gaussian filter to produce a cleaner input series that suppresses rapid spikes.
3. VIDYA Adaptive Average
o Computes a dynamic EMA whose smoothing constant adjusts according to the ratio of short- and long-term standard deviations—making it inherently responsive in volatile times and smooth in calmer periods.
4. Volatility Bands
o Surrounds the VIDYA line with ±N×SD bands (separate multipliers for upper and lower) to capture current market volatility, yielding dynamic thresholds for trend detection.
5. Trend Signal
o Generates a “long” when price closes above the upper band, a “short” when it closes below the lower band, otherwise stays neutral.
💡 Why It’s Special
• Adaptive Responsiveness: VIDYA’s volatility-weighted smoothing constant speeds up trend recognition in choppy markets and slows in quiet ones, avoiding whipsaws.
• Multi-Stage Filtering: The DEMA→Gaussian→VIDYA sequence ensures both rapid noise suppression and flexible trend adaptation.
• Asymmetric Bands: Separate multipliers for the upper and lower volatility bands let you fine-tune sensitivity to bullish versus bearish impulses.
• Visual Clarity: Color-coded candles and filled bands highlight trending phases at a glance, while backtest tables quantify performance.
📊 Backtest Mode
AVBO includes an optional backtest table, enabling traders to assess its historical effectiveness before applying it in live trading conditions.
🔹 Backtest Metrics Displayed:
• Equity Max Drawdown → Largest historical loss from peak equity.
• Profit Factor → Ratio of total profits to total losses, measuring system efficiency.
• Sharpe Ratio → Assesses risk-adjusted return performance.
• Sortino Ratio → Focuses on downside risk-adjusted returns.
• Omega Ratio → Evaluates return consistency & performance asymmetry.
• Half Kelly → Optimal position sizing based on risk/reward analysis.
• Total Trades & Win Rate → Assess historical success rate.
BTC
ETH
📌 Disclaimer:
Backtest results are based on past performance and do not guarantee future success. Always incorporate real-time validation and risk management in live trading.
💼 Ideal Use Cases
• Trend Identification: Pinpoint reliable trend starts and exits in stocks, FX, or crypto—minimizing lag and false breakouts.
• Volatility Regimes: Automatically adjust to quiet vs. explosive markets—no manual parameter tweaks needed.
• Multitimeframe Alignment: Use SVS on multiple timeframes to confirm trend direction before entering positions.
• System Building Block: Embed SVS as a robust, adaptive filter within larger strategies (e.g., to trigger entries or to validate signals from other indicators).
🎨 Default Configuration
• DEMA Length: 7
• Gaussian Kernel: length = 4, sigma = 2.0
• VIDYA Lengths: fast = 9, slow = 24 (or use presets Set1–Set4)
• Volatility Bands: SD length = 40
📌 In Summary
Simple VIDYA Smooth | QuantEdgeB is an adaptive trend-filtering indicator that layers multiple noise-suppressing and volatility-adjusting techniques to deliver clear, reliable trend signals. By marrying DEMA, Gaussian filtering, VIDYA’s volatility-driven smoothing, and dynamic SD bands, SVS excels at separating genuine directional moves from market noise—across any asset or timeframe.
🔹 Disclaimer: Past performance is not indicative of future results. Always backtest and align AVBO’s settings with your risk tolerance and market objectives before live trading.
🔹 Strategic Advice: Always backtest, optimize, and align parameters with your trading objectives and risk tolerance before live trading.
僅限邀請腳本
僅作者批准的使用者才能訪問此腳本。您需要申請並獲得使用許可,通常需在付款後才能取得。更多詳情,請依照作者以下的指示操作,或直接聯絡QuantEdgeB。
TradingView不建議在未完全信任作者並了解其運作方式的情況下購買或使用腳本。您也可以在我們的社群腳本中找到免費的開源替代方案。
作者的說明
Please check out our Whop page for access!! https://whop.com/quantedgeb/
🔹 Get access to our premium tools:
whop.com/quantedgeb/ 💎
🔹 Unlock our free toolbox:
tradinglibrary.carrd.co/ 🛠️
Disclaimer: All resources and indicators provided are for educational purposes only
whop.com/quantedgeb/ 💎
🔹 Unlock our free toolbox:
tradinglibrary.carrd.co/ 🛠️
Disclaimer: All resources and indicators provided are for educational purposes only
免責聲明
這些資訊和出版物並非旨在提供,也不構成TradingView提供或認可的任何形式的財務、投資、交易或其他類型的建議或推薦。請閱讀使用條款以了解更多資訊。