OPEN-SOURCE SCRIPT
MFE & MAE Tool
This is a simple implementation of the MFE/MAE Tool for TradingView.
It's a quite powerful tool and pretty useful in systematic trading, but I don't see many trader using it these days.
It's created for EMA cross, but you can easily change it to use your own signals.
What is MAE/MFE Tool
The idea is pretty simple. We take only signals without any position management or exits and measure the best/worst P&L for the next X bars after the signal was.
The primary use case for it is to understand how good your signals are .
If you'll add complicated money management tools, exits, and SL/PT to your strategy, it brings quite a lot of noise. After that, it's pretty tricky to understand if your signals bring much information about future price movements. In other words, bad money management can ruin good signals, and you might discard the entire strategy without knowing that. So this is why I think it's important to check the quality of your signals separately.
Another simple way to use it is to estimate where to put SL/PT
In this example, we're computing MAE/MFE in percent. We're plotting it both on the chart and computing some statistics based on it. This is why it's pretty easy to get a quick understanding of what is your SL/PT should be.
MAE/MFE tool consists of a:
The indicator is highly customizable, you can configure:
EMA cross and its parameter were selected randomly, so don't estimate to see a great performance here.
MFE/MAE tool is a pretty powerful concept. At some point, I'll create an entire article in my blog with more examples and descriptions.
Thanks to MUQWISHI for helping code it.
Disclaimer
Please remember that past performance may not indicate future results.
Due to various factors, including changing market conditions, the strategy may no longer perform as well as in historical backtesting.
This post and the script don’t provide any financial advice.
It's a quite powerful tool and pretty useful in systematic trading, but I don't see many trader using it these days.
It's created for EMA cross, but you can easily change it to use your own signals.
What is MAE/MFE Tool
- MAE stands for Maximum Adverse Excursion - Worst P&L during the trade
- MFE stands for Maximum Favorable Excursion - Best P&L during the trade
The idea is pretty simple. We take only signals without any position management or exits and measure the best/worst P&L for the next X bars after the signal was.
The primary use case for it is to understand how good your signals are .
If you'll add complicated money management tools, exits, and SL/PT to your strategy, it brings quite a lot of noise. After that, it's pretty tricky to understand if your signals bring much information about future price movements. In other words, bad money management can ruin good signals, and you might discard the entire strategy without knowing that. So this is why I think it's important to check the quality of your signals separately.
Another simple way to use it is to estimate where to put SL/PT
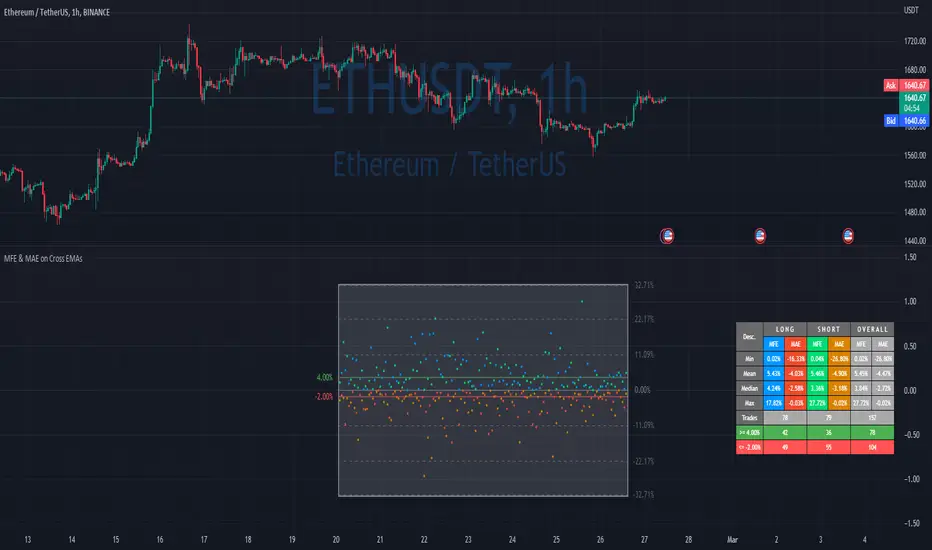
In this example, we're computing MAE/MFE in percent. We're plotting it both on the chart and computing some statistics based on it. This is why it's pretty easy to get a quick understanding of what is your SL/PT should be.
MAE/MFE tool consists of a:
- Chart - it displays a point for every signal. Long/Short trades can have different colors. On hover you'll see details for this signal.
- Table with stats - we're computing basic metrics for these Signals like average/min/median/max MAE/MFE, number of trades, and how many trades hit selected SL and PT. Stats are also separated by the side so you can see performance separately for longs and shorts.
The indicator is highly customizable, you can configure:
- Bars you want to use to compute MAE/MFE
- Side selection
- SL and R:R
- Styling of the chart
- Position and style of the table
- Parameters for the EMA
EMA cross and its parameter were selected randomly, so don't estimate to see a great performance here.
MFE/MAE tool is a pretty powerful concept. At some point, I'll create an entire article in my blog with more examples and descriptions.
Thanks to MUQWISHI for helping code it.
Disclaimer
Please remember that past performance may not indicate future results.
Due to various factors, including changing market conditions, the strategy may no longer perform as well as in historical backtesting.
This post and the script don’t provide any financial advice.
開源腳本
秉持TradingView一貫精神,這個腳本的創作者將其設為開源,以便交易者檢視並驗證其功能。向作者致敬!您可以免費使用此腳本,但請注意,重新發佈代碼需遵守我們的社群規範。
Quant Developer | Pine Script v6 | Python & R
12+ yrs system. trading, hedge fund experience
Custom indicators, strategies & screeners
Futures & options
💼 Hire/Consulting:
qntly.com/hire
🎓 PineScript V6 Course:
qntly.com/ps6
12+ yrs system. trading, hedge fund experience
Custom indicators, strategies & screeners
Futures & options
💼 Hire/Consulting:
qntly.com/hire
🎓 PineScript V6 Course:
qntly.com/ps6
免責聲明
這些資訊和出版物並非旨在提供,也不構成TradingView提供或認可的任何形式的財務、投資、交易或其他類型的建議或推薦。請閱讀使用條款以了解更多資訊。