OPEN-SOURCE SCRIPT
已更新 Ultra Moving Average
The Ultra Moving Average is a versatile technical indicator that combines various types of moving averages to analyze trends, providing multi-timeframe insights for traders. It offers four customizable moving averages and a trend strength table for enhanced decision-making.
Introduction
The Ultra Moving Average indicator is a powerful tool designed to help traders track market trends by offering a combination of four distinct moving averages. With flexible customization options, users can apply different types of moving averages like SMA, EMA, TEMA, and many more, across various timeframes. Additionally, it provides trend strength analysis through an intuitive visual table, helping traders quickly identify market conditions.
Detailed Description
.........
- Moving Averages
Each of the four moving averages is independently configurable. You can select the timeframe, type, length, color, and width to match your trading strategy.
The types of moving averages range from traditional ones like the Simple Moving Average (SMA) to advanced ones like the Double Expotential Moving Average (DEMA) or the Triple Exponential Moving Average (TEMA) or the Recursive Moving Average (RMA) or the Weigthend Moving Average (WMA) or the Volume Weigthend Moving Average (VWMA) or Hull Moving Average (HMA).
Very Special ones are the Triple Weigthend Moving Average (TWMA) wich created RedKTrader.
I created the Multi Weigthend Moving Average (MWMA) wich is a simple signal line to the TWMA.
..... - Trend Visualization
The indicator uses color-coding to visually represent whether the price is in an uptrend or downtrend. Bullish trends are highlighted in one color, while bearish trends appear in another, making it easy to interpret.
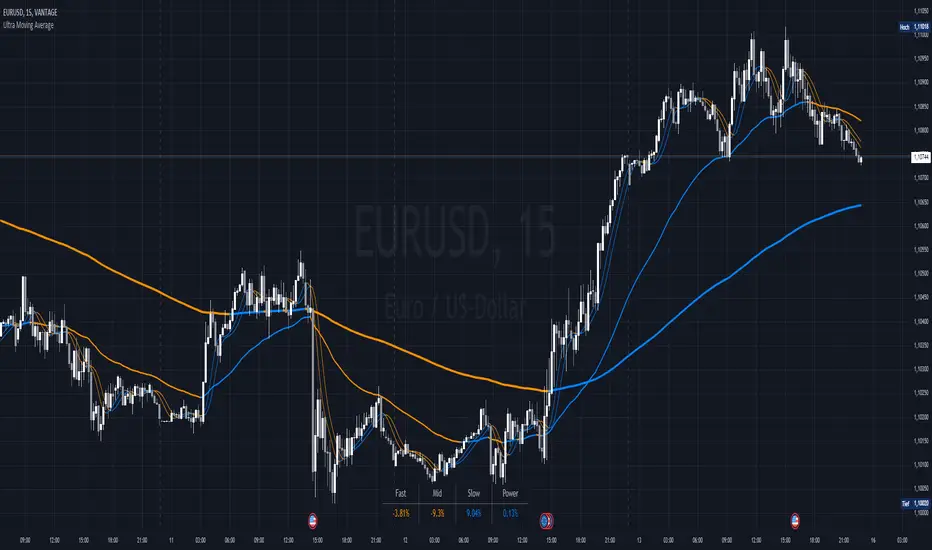
..... - Trend Strength Table
One of the unique features of the Ultra Moving Average is the trend strength table at the bottom of the chart. This table breaks down the strength of the fast, mid, and slow moving averages, displaying them as percentages. It also shows the overall "trend power," which helps assess how strong or weak the current trend is.
You have the option to calculate trends using live data or the previous bar's data, offering flexibility in how the indicator reacts to market changes. This can help traders make more responsive decisions based on real-time trends.
The table displays trend strength across three timeframes Fast, Mid, and Slow by calculating the percentage difference between the price and each of the moving averages (MA1, MA3, MA4).
The Power row shows the average of these percentages, representing overall trend strength.
The percentages are calculated relative to their maximum values in history (limited by TradingView subscription), providing insight into the trend's strength for each timeframe.
.........
Overall, the Ultra Moving Average indicator is a comprehensive tool that combines multiple moving average types and advanced trend analysis, helping traders identify market direction and strength at a glance. With its intuitive visualization and flexible settings, it's suited for both beginner and experienced traders.
Special Thanks
I use the TWMA-Function created from RedKTrader to smooth the values.
Special thanks to him for creating and sharing this function!
發行說明
update (added Trend Flow Line (TFL) and Symetric Weightend Moving Average (SWMA))開源腳本
秉持TradingView一貫精神,這個腳本的創作者將其設為開源,以便交易者檢視並驗證其功能。向作者致敬!您可以免費使用此腳本,但請注意,重新發佈代碼需遵守我們的社群規範。
免責聲明
這些資訊和出版物並非旨在提供,也不構成TradingView提供或認可的任何形式的財務、投資、交易或其他類型的建議或推薦。請閱讀使用條款以了解更多資訊。
免責聲明
這些資訊和出版物並非旨在提供,也不構成TradingView提供或認可的任何形式的財務、投資、交易或其他類型的建議或推薦。請閱讀使用條款以了解更多資訊。