INVITE-ONLY SCRIPT
Socrate's Bottom Finder
ENGLISH :
Hi everybody,
This indicator will give you the market bottoms with remarkable accuracy.
/!\ Be aware that the indicator cannot know the current economic situation and that in the event of a major crisis, it can signal a market bottom despite the decline not being over. /!\
How to read it ?
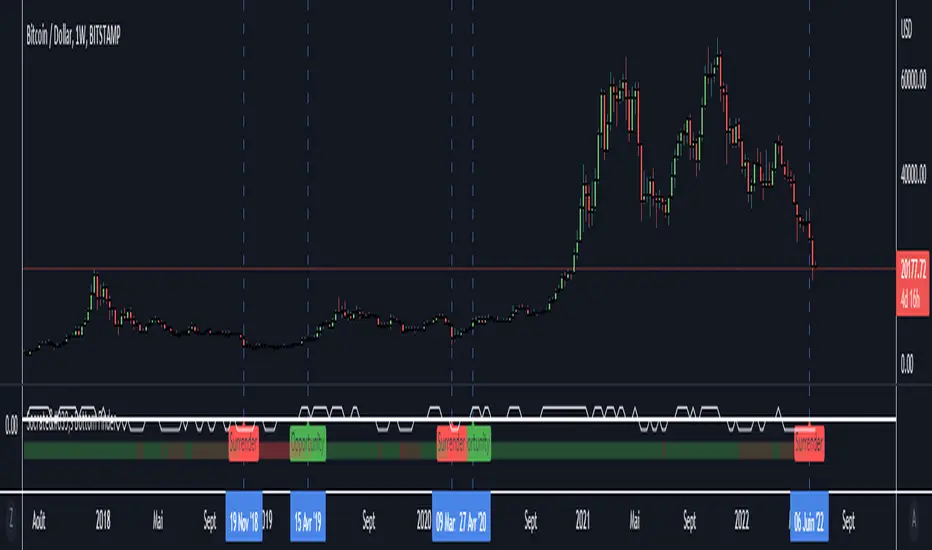
It is composed of two visual sections:
- The first section materialized by the white line is a "treshhold" which gives the current trend of the week. It is used to filter most of the "fake signals"
- The second section, materialized by a green and red band, gives the strength of the price trend. If for example the trend is rather bullish, this bar will turn green, the opposit will produce red. An "opportunity" signal will appear when the optimal conditions are met to define a market bottom. Before an opportunity signal there will always be an "Surrender" signal, wich means the trend has weakened and the bottom is near in time.
Special Recommandation :
- The best results are on 1W, 3D, 1D. The indicator work on lower TF but it's not his purpose and you may drop significantly your W/L rate.
- Avoid stocks/crypto with poor stability in the very long time, a good hint is to look after thoses who mostly are above SMA200 on weekly TF.
- Avoid cyclical stock, as they tend to bounce up and down way to often.
Please do your own diligence. Trading may conduct you to loose capital.
Apply your own trading strategy :)
-----------------------------------------------------------------------------------------------------------------------------
FRANCAIS :
Salut tout le monde,
Cet indicateur vous donnera les creux du marché avec une précision remarquable.
/!\ Sachez que l'indicateur ne peut pas connaître la situation économique actuelle et qu'en cas de crise majeure, il peut signaler un creux de marché même si la baisse n'est pas terminée. /!\
Comment le lire ?
Il est composé de deux sections visuelles :
- La première section matérialisée par la ligne blanche est un « seuil » qui donne la tendance actuelle de la semaine. Il est utilisé pour filtrer la plupart des "faux signaux"
- La deuxième section, matérialisée par une bande verte et rouge, donne la force de la tendance des prix. Si par exemple la tendance est plutôt haussière, cette barre deviendra verte, l'inverse produira du rouge. Un signal "d'opportunité" apparaîtra lorsque les conditions optimales seront réunies pour définir un creux de marché. Avant un signal d'opportunité, il y aura toujours un signal "Abandon", ce qui signifie que la tendance s'est affaiblie et que le creux est proche dans le temps.
Recommandations spéciales :
- Les meilleurs résultats sont sur 1W, 3D, 1D. L'indicateur fonctionne sur des TF plus faibles mais ce n'est pas son but et vous risquez de faire chuter considérablement votre ratio de W/L.
- Évitez les stocks/crypto avec une faible stabilité sur le long terme, un bon indice est de cibler ceux qui sont majoritairement (dans leur historique) au-dessus de leur SMA200 en TF hebdomadaire.
- Prioriser les actifs de type "HyperGrowth", l'indicateur fonctionne moins bien avec les cycliques
Veuillez faire vos propres recherches en parallèle. Le trading pouvant vous conduire à perdre du capital.
Appliquez à cet indicateur votre propre stratégie :)
Hi everybody,
This indicator will give you the market bottoms with remarkable accuracy.
/!\ Be aware that the indicator cannot know the current economic situation and that in the event of a major crisis, it can signal a market bottom despite the decline not being over. /!\
How to read it ?
It is composed of two visual sections:
- The first section materialized by the white line is a "treshhold" which gives the current trend of the week. It is used to filter most of the "fake signals"
- The second section, materialized by a green and red band, gives the strength of the price trend. If for example the trend is rather bullish, this bar will turn green, the opposit will produce red. An "opportunity" signal will appear when the optimal conditions are met to define a market bottom. Before an opportunity signal there will always be an "Surrender" signal, wich means the trend has weakened and the bottom is near in time.
Special Recommandation :
- The best results are on 1W, 3D, 1D. The indicator work on lower TF but it's not his purpose and you may drop significantly your W/L rate.
- Avoid stocks/crypto with poor stability in the very long time, a good hint is to look after thoses who mostly are above SMA200 on weekly TF.
- Avoid cyclical stock, as they tend to bounce up and down way to often.
Please do your own diligence. Trading may conduct you to loose capital.
Apply your own trading strategy :)
-----------------------------------------------------------------------------------------------------------------------------
FRANCAIS :
Salut tout le monde,
Cet indicateur vous donnera les creux du marché avec une précision remarquable.
/!\ Sachez que l'indicateur ne peut pas connaître la situation économique actuelle et qu'en cas de crise majeure, il peut signaler un creux de marché même si la baisse n'est pas terminée. /!\
Comment le lire ?
Il est composé de deux sections visuelles :
- La première section matérialisée par la ligne blanche est un « seuil » qui donne la tendance actuelle de la semaine. Il est utilisé pour filtrer la plupart des "faux signaux"
- La deuxième section, matérialisée par une bande verte et rouge, donne la force de la tendance des prix. Si par exemple la tendance est plutôt haussière, cette barre deviendra verte, l'inverse produira du rouge. Un signal "d'opportunité" apparaîtra lorsque les conditions optimales seront réunies pour définir un creux de marché. Avant un signal d'opportunité, il y aura toujours un signal "Abandon", ce qui signifie que la tendance s'est affaiblie et que le creux est proche dans le temps.
Recommandations spéciales :
- Les meilleurs résultats sont sur 1W, 3D, 1D. L'indicateur fonctionne sur des TF plus faibles mais ce n'est pas son but et vous risquez de faire chuter considérablement votre ratio de W/L.
- Évitez les stocks/crypto avec une faible stabilité sur le long terme, un bon indice est de cibler ceux qui sont majoritairement (dans leur historique) au-dessus de leur SMA200 en TF hebdomadaire.
- Prioriser les actifs de type "HyperGrowth", l'indicateur fonctionne moins bien avec les cycliques
Veuillez faire vos propres recherches en parallèle. Le trading pouvant vous conduire à perdre du capital.
Appliquez à cet indicateur votre propre stratégie :)
僅限邀請腳本
僅作者批准的使用者才能訪問此腳本。您需要申請並獲得使用許可,通常需在付款後才能取得。更多詳情,請依照作者以下的指示操作,或直接聯絡Socrate_FR。
TradingView不建議在未完全信任作者並了解其運作方式的情況下購買或使用腳本。您也可以在我們的社群腳本中找到免費的開源替代方案。
作者的說明
This indicator does not predict the futur.
It's only a trend based "high probability" hint.
The indicator cannot know about Macro-economics.
Please do your own diligence.
免責聲明
這些資訊和出版物並非旨在提供,也不構成TradingView提供或認可的任何形式的財務、投資、交易或其他類型的建議或推薦。請閱讀使用條款以了解更多資訊。