PROTECTED SOURCE SCRIPT
已更新 PrismWAP (Anchored)
# PrismWAP (Anchored)
Overview
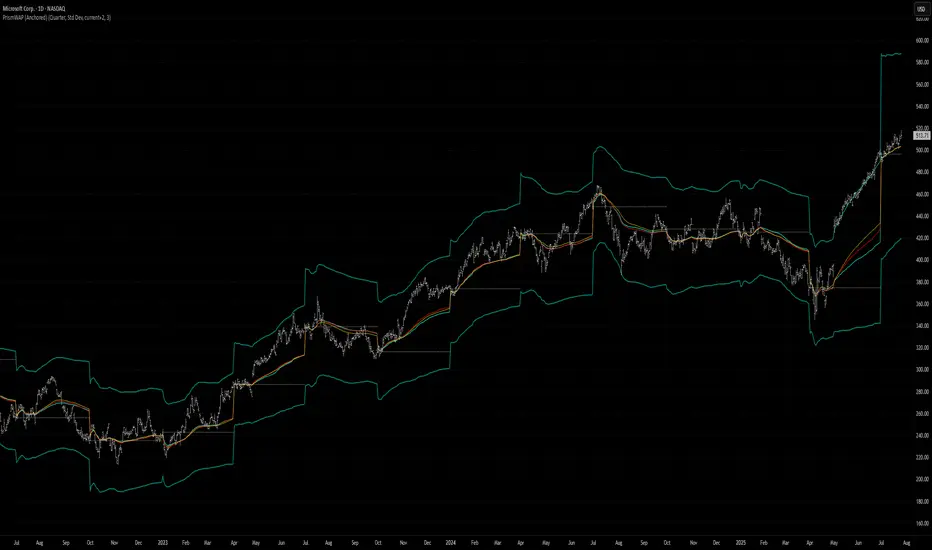
PrismWAP plots three anchored weighted-average prices (VWAP, TWAP, TrueWAP) with dynamic volatility bands and a resettable anchor line. It helps you see key value levels since your chosen anchor period and gauge price excursions relative to volatility.
How It Works
On each new span (session, week, month, quarter, etc.), the indicator resets a base price from the first bar’s open. It computes anchored VWAP, TWAP, and TrueWAP cumulatively over the span. Volatility bands are drawn as ±multiplier × a span-length-weighted average of your chosen volatility measure (Std Dev, MAD, ATR-scaled, or Percent of WAP).
Inputs
Settings/Default/Description
Anchor Period/Quarter/Span for resetting WAP and anchor line (Week, Month, etc.)
Volatility Measure/Std Dev/Method for band width: SD, MAD, ATR (scaled), Percent of WAP
Volatility Spans/current+2/Number of spans (current + previous spans) used in volatility
Band Multiplier(or %)/3.0/Multiplier for band width (or Percent of WAP in Percent mode)
Scale MAD to σ/true/When MAD selected, scale by √(π/2) so it aligns with σ
Display
• Show Anchor Line true
• Show VWAP true
• Show TWAP true
• Show TrueWAP true
• Show VWAP Bands false
• Show TWAP Bands false
• Show TrueWAP Bands true
Tips & Use Cases
• Use shorter spans (Session, Week) for sub-daily bar intervals.
• Use longer spans (Quarter, Year) for daily bar intervals.
References:
1. TrueWAP Description
2. SD, MAD, ATR (scaled) weighted average volatility
## 1. TrueWAP: Volatility-Weighted Price Averaging
What Is TrueWAP?
TrueWAP plugs actual price fluctuations into your average. Instead of only tracking time (TWAP) or volume (VWAP), it weights each bar’s TrueRange midpoint by its TrueRange—so when the market moves more, that bar counts more.
TrueWAP (Anchored) Overview
• On the first bar, it uses the simple high-low midpoint for price and the bar’s high-low range for weighting.
• From the next bar onward, it computes TrueMid by averaging the TrueRange high (higher of prior close or current high) with the TrueRange low (lower of prior close or current low).
• Each TrueMid is weighted by its TrueRange and cumulatively summed from the anchor point.
Pseudocode
// TWAP Example for Comparison
current_days = BarsSince("start_of_period")
OHLC = (Open + High + Low + Close) / 4
TWAP = MA(OHLC, current_days)
// VWAP Example for Comparison
current_days = BarsSince("start_of_period")
HLC3 = (High + Low + Close) / 3
VWAP = Sum(HLC3 * Volume, current_days) / Sum(Volume, current_days)
// TrueWAP (Anchored)
current_days = BarsSince("start_of_period") // Count of bars since the period began
first_bar = (current_days == 0) // Boolean flag that is true if current bar is the first of period
hilo_mid = (High + Low) / 2 // For the first bar, use its simple high/low avg
max_val = max(Close[-1], High) // For subsequent bars, TrueRange high
min_val = min(Close[-1], Low) // For subsequent bars, TrueRange low
true_mid = (max_val + min_val) / 2 // True Range midpoint for subsequent bars
// Use hilo_mid and (High - Low) for the first bar; otherwise, use true_mid and True Range
mid_val = IF(first_bar, hilo_mid, true_mid)
range_val = IF(first_bar, (High - Low), TrueRange)
TrueWAP = Sum(mid_val * range_val, current_days) / Sum(range_val, current_days)
Recap: Interpretation
• The first bar uses the simple high-low midpoint and range.
• Subsequent bars use TrueMid and TrueRange based on prior close.
• This ensures the average reflects only the observed volatility and price since the anchor.
A Note on True Range
TrueRange captures the full extent of bar-to-bar volatility as the maximum of:
• High – Low
• |High – Previous Close|
• |Low – Previous Close|
## 2. Segmented Weighted-Average Volatility: A Fixed-Point Multi-Period Approach
### Introduction
Conventional standard deviation calculations aggregate data over an expanding window and rely on a single mean, producing one summary statistic. This can obscure segmented, sequential datasets—such as MTD, QTD, and YTD—where additional granularity and time-sensitive insights matter.
This methodology isolates standard deviation within defined time frames and then proportionally allocates them based on custom lookback criteria. The result is a dynamic, multi-period normalization benchmark that captures both emerging volatility and historical stability.
Note: While this example uses SD, the same fixed-point approach applies to MAD and ATR (scaled).
### 2.1 Standard Deviation (Rolling Window)
pseudocode
// -- STANDARD DEVIATION (ROLLING) Calculation --
window_size = 20
rolling_SD = STDDEV(Close, window_size)
• Ideal for immediate trading insights.
• Reflects pure, short-term price dynamics.
• Captures volatility using the most recent 20 trading days.
### 2.2 Blended SD: Current + 3 Past Periods
This method fuses current month data with the last three complete months.
pseudocode
// -- MULTI-PERIOD STANDARD DEVIATION (PROXY) with Three Past Periods --
current_days = BarsSince("start_of_month")
current_SD = STDDEV(Close, current_days)
prev1_days = TradingDaysLastMonth
prev1_SD = STDDEV_LastMonth(Close)
prev2_days = TradingDaysTwoMonthsAgo
prev2_SD = STDDEV_TwoMonthsAgo(Close)
prev3_days = TradingDaysThreeMonthsAgo
prev3_SD = STDDEV_ThreeMonthsAgo(Close)
// Blending with Proportional Weights
Weighted_SD = (current_SD * current_days +
prev1_SD * prev1_days +
prev2_SD * prev2_days +
prev3_SD * prev3_days) /
(current_days + prev1_days + prev2_days + prev3_days)
• Merges evolving volatility with the stability of three prior months.
• Weights each period by its trading days.
• Yields a robust normalization benchmark.
### 2.3 Blended SD: Current + 1 Past Period
This variant tempers emerging volatility by blending the current month with last month only.
pseudocode
// -- MULTI-PERIOD STANDARD DEVIATION (PROXY) with One Past Period --
current_days = BarsSince("start_of_month")
current_SD = STDDEV(Close, current_days)
prev1_days = TradingDaysLastMonth
prev1_SD = STDDEV_LastMonth(Close)
// Proportional Blend
Weighted_SD = (current_SD * current_days +
prev1_SD * prev1_days) /
(current_days + prev1_days)
• Anchors current volatility to last month’s baseline.
• Softens spikes by blending with historical data.
Conclusion
Segmented weighted-average volatility transforms global benchmarking by integrating immediate market dynamics with enduring historical context. This fixed-point approach—applicable to SD, MAD (scaled), and ATR (scaled)—delivers time-sensitive analysis.
Overview
PrismWAP plots three anchored weighted-average prices (VWAP, TWAP, TrueWAP) with dynamic volatility bands and a resettable anchor line. It helps you see key value levels since your chosen anchor period and gauge price excursions relative to volatility.
How It Works
On each new span (session, week, month, quarter, etc.), the indicator resets a base price from the first bar’s open. It computes anchored VWAP, TWAP, and TrueWAP cumulatively over the span. Volatility bands are drawn as ±multiplier × a span-length-weighted average of your chosen volatility measure (Std Dev, MAD, ATR-scaled, or Percent of WAP).
Inputs
Settings/Default/Description
Anchor Period/Quarter/Span for resetting WAP and anchor line (Week, Month, etc.)
Volatility Measure/Std Dev/Method for band width: SD, MAD, ATR (scaled), Percent of WAP
Volatility Spans/current+2/Number of spans (current + previous spans) used in volatility
Band Multiplier(or %)/3.0/Multiplier for band width (or Percent of WAP in Percent mode)
Scale MAD to σ/true/When MAD selected, scale by √(π/2) so it aligns with σ
Display
• Show Anchor Line true
• Show VWAP true
• Show TWAP true
• Show TrueWAP true
• Show VWAP Bands false
• Show TWAP Bands false
• Show TrueWAP Bands true
Tips & Use Cases
• Use shorter spans (Session, Week) for sub-daily bar intervals.
• Use longer spans (Quarter, Year) for daily bar intervals.
References:
1. TrueWAP Description
2. SD, MAD, ATR (scaled) weighted average volatility
## 1. TrueWAP: Volatility-Weighted Price Averaging
What Is TrueWAP?
TrueWAP plugs actual price fluctuations into your average. Instead of only tracking time (TWAP) or volume (VWAP), it weights each bar’s TrueRange midpoint by its TrueRange—so when the market moves more, that bar counts more.
TrueWAP (Anchored) Overview
• On the first bar, it uses the simple high-low midpoint for price and the bar’s high-low range for weighting.
• From the next bar onward, it computes TrueMid by averaging the TrueRange high (higher of prior close or current high) with the TrueRange low (lower of prior close or current low).
• Each TrueMid is weighted by its TrueRange and cumulatively summed from the anchor point.
Pseudocode
// TWAP Example for Comparison
current_days = BarsSince("start_of_period")
OHLC = (Open + High + Low + Close) / 4
TWAP = MA(OHLC, current_days)
// VWAP Example for Comparison
current_days = BarsSince("start_of_period")
HLC3 = (High + Low + Close) / 3
VWAP = Sum(HLC3 * Volume, current_days) / Sum(Volume, current_days)
// TrueWAP (Anchored)
current_days = BarsSince("start_of_period") // Count of bars since the period began
first_bar = (current_days == 0) // Boolean flag that is true if current bar is the first of period
hilo_mid = (High + Low) / 2 // For the first bar, use its simple high/low avg
max_val = max(Close[-1], High) // For subsequent bars, TrueRange high
min_val = min(Close[-1], Low) // For subsequent bars, TrueRange low
true_mid = (max_val + min_val) / 2 // True Range midpoint for subsequent bars
// Use hilo_mid and (High - Low) for the first bar; otherwise, use true_mid and True Range
mid_val = IF(first_bar, hilo_mid, true_mid)
range_val = IF(first_bar, (High - Low), TrueRange)
TrueWAP = Sum(mid_val * range_val, current_days) / Sum(range_val, current_days)
Recap: Interpretation
• The first bar uses the simple high-low midpoint and range.
• Subsequent bars use TrueMid and TrueRange based on prior close.
• This ensures the average reflects only the observed volatility and price since the anchor.
A Note on True Range
TrueRange captures the full extent of bar-to-bar volatility as the maximum of:
• High – Low
• |High – Previous Close|
• |Low – Previous Close|
## 2. Segmented Weighted-Average Volatility: A Fixed-Point Multi-Period Approach
### Introduction
Conventional standard deviation calculations aggregate data over an expanding window and rely on a single mean, producing one summary statistic. This can obscure segmented, sequential datasets—such as MTD, QTD, and YTD—where additional granularity and time-sensitive insights matter.
This methodology isolates standard deviation within defined time frames and then proportionally allocates them based on custom lookback criteria. The result is a dynamic, multi-period normalization benchmark that captures both emerging volatility and historical stability.
Note: While this example uses SD, the same fixed-point approach applies to MAD and ATR (scaled).
### 2.1 Standard Deviation (Rolling Window)
pseudocode
// -- STANDARD DEVIATION (ROLLING) Calculation --
window_size = 20
rolling_SD = STDDEV(Close, window_size)
• Ideal for immediate trading insights.
• Reflects pure, short-term price dynamics.
• Captures volatility using the most recent 20 trading days.
### 2.2 Blended SD: Current + 3 Past Periods
This method fuses current month data with the last three complete months.
pseudocode
// -- MULTI-PERIOD STANDARD DEVIATION (PROXY) with Three Past Periods --
current_days = BarsSince("start_of_month")
current_SD = STDDEV(Close, current_days)
prev1_days = TradingDaysLastMonth
prev1_SD = STDDEV_LastMonth(Close)
prev2_days = TradingDaysTwoMonthsAgo
prev2_SD = STDDEV_TwoMonthsAgo(Close)
prev3_days = TradingDaysThreeMonthsAgo
prev3_SD = STDDEV_ThreeMonthsAgo(Close)
// Blending with Proportional Weights
Weighted_SD = (current_SD * current_days +
prev1_SD * prev1_days +
prev2_SD * prev2_days +
prev3_SD * prev3_days) /
(current_days + prev1_days + prev2_days + prev3_days)
• Merges evolving volatility with the stability of three prior months.
• Weights each period by its trading days.
• Yields a robust normalization benchmark.
### 2.3 Blended SD: Current + 1 Past Period
This variant tempers emerging volatility by blending the current month with last month only.
pseudocode
// -- MULTI-PERIOD STANDARD DEVIATION (PROXY) with One Past Period --
current_days = BarsSince("start_of_month")
current_SD = STDDEV(Close, current_days)
prev1_days = TradingDaysLastMonth
prev1_SD = STDDEV_LastMonth(Close)
// Proportional Blend
Weighted_SD = (current_SD * current_days +
prev1_SD * prev1_days) /
(current_days + prev1_days)
• Anchors current volatility to last month’s baseline.
• Softens spikes by blending with historical data.
Conclusion
Segmented weighted-average volatility transforms global benchmarking by integrating immediate market dynamics with enduring historical context. This fixed-point approach—applicable to SD, MAD (scaled), and ATR (scaled)—delivers time-sensitive analysis.
發行說明
# PrismWAP (Anchored)Overview
PrismWAP plots three anchored weighted-average prices (VWAP, TWAP, TrueWAP) with dynamic volatility bands and a resettable anchor line. It helps you see key value levels since your chosen anchor period and gauge price excursions relative to volatility.
How It Works
On each new span (session, week, month, quarter, etc.), the indicator resets a base price from the first bar’s open. It computes anchored VWAP, TWAP, and TrueWAP cumulatively over the span. Volatility bands are drawn as ±multiplier × a span-length-weighted average of your chosen volatility measure (Std Dev, MAD, ATR-scaled, or Percent of WAP).
Inputs
Settings Description
Anchor Period Span for resetting WAP and anchor line (Week, Month, etc.)
Volatility Measure Method for band width: Std Dev, MAD, ATR (scaled), or Percent of WAP
Volatility Spans Number of spans (current + previous spans) used in weighted average volatility
Band Multiplier (or %) Multiplier for band width (or Percent of WAP in Percent mode)
Scale MAD to σ Scale Mad by √(π/2) so it aligns with σ under Normal distribution
Display
• Show Anchor Line
• Show VWAP
• Show TWAP
• Show TrueWAP
• Show VWAP Bands
• Show TWAP Bands
• Show TrueWAP Bands
Tips & Use Cases
• Use shorter spans (Session, Week) for sub-daily bar intervals.
• Use longer spans (Quarter, Year) for daily bar intervals.
References:
1. TrueWAP Description
2. SD, MAD, ATR (scaled) weighted average volatility
## 1. TrueWAP: Volatility-Weighted Price Averaging
What Is TrueWAP?
TrueWAP plugs actual price fluctuations into your average. Instead of only tracking time (TWAP) or volume (VWAP), it weights each bar’s TrueRange midpoint by its TrueRange—so when the market moves more, that bar counts more.
In short, it’s a *TrueRange-weighted TrueMid average* anchored at your start date.
TrueWAP (Anchored) Overview
• On the first bar, it uses the simple high-low midpoint for price and the bar’s high-low range for weighting.
• From the next bar onward, it computes TrueMid by averaging the TrueRange high (higher of prior close or current high) with the TrueRange low (lower of prior close or current low).
• Each TrueMid is weighted by its TrueRange and cumulatively summed from the anchor point.
Pseudocode
// TWAP Example for Comparison
current_days = BarsSince("start_of_period")
OHLC = (Open + High + Low + Close) / 4
TWAP = MA(OHLC, current_days)
// VWAP Example for Comparison
current_days = BarsSince("start_of_period")
HLC3 = (High + Low + Close) / 3
VWAP = Sum(HLC3 * Volume, current_days) / Sum(Volume, current_days)
// TrueWAP (Anchored)
current_days = BarsSince("start_of_period") // Count of bars since the period began
first_bar = (current_days == 0) // Boolean flag if current bar is 1st of period
hilo_mid = (High + Low) / 2
max_val = max(Close[-1], High)
min_val = min(Close[-1], Low)
true_mid = (max_val + min_val) / 2
// Use hilo_mid and (High - Low) for the first bar; otherwise, use true_mid and True Range
mid_val = IF(first_bar, hilo_mid, true_mid)
range_val = IF(first_bar, (High - Low), TrueRange)
TrueWAP = Sum(mid_val * range_val, current_days) / Sum(range_val, current_days)
Recap: Interpretation
• The first bar uses the simple high-low midpoint and range.
• Subsequent bars use TrueMid and TrueRange based on prior close.
• This ensures the average reflects only the observed volatility and price since the anchor.
A Note on True Range
TrueRange captures the full extent of bar-to-bar volatility as the maximum of:
• High – Low
• |High – Previous Close|
• |Low – Previous Close|
## 2. Segmented Weighted-Average Volatility: A Fixed-Point Multi-Period Approach
### Introduction
Conventional standard deviation calculations aggregate data over an expanding window and rely on a single mean, producing one summary statistic. This can obscure segmented, sequential datasets—such as MTD, QTD, and YTD—where additional granularity and time-sensitive insights matter.
This methodology isolates standard deviation within defined time frames and then proportionally allocates them based on custom lookback criteria. The result is a dynamic, multi-period normalization benchmark that captures both emerging volatility and historical stability.
Note: While this example uses SD, the same fixed-point approach applies to MAD and ATR (scaled).
### 2.1 Standard Deviation (Rolling Window)
pseudocode
// -- STANDARD DEVIATION (ROLLING) Calculation --
window_size = 20
rolling_SD = STDDEV(Close, window_size)
• Ideal for immediate trading insights.
• Reflects pure, short-term price dynamics.
• Captures volatility using the most recent 20 trading days.
### 2.2 Blended SD: Current + 3 Past Periods
This method fuses current month data with the last three complete months.
pseudocode
// -- MULTI-PERIOD STANDARD DEVIATION (PROXY) with Three Past Periods --
current_days = BarsSince("start_of_month")
current_SD = STDDEV(Close, current_days)
prev1_days = TradingDaysLastMonth
prev1_SD = STDDEV_LastMonth(Close)
prev2_days = TradingDaysTwoMonthsAgo
prev2_SD = STDDEV_TwoMonthsAgo(Close)
prev3_days = TradingDaysThreeMonthsAgo
prev3_SD = STDDEV_ThreeMonthsAgo(Close)
// Blending with Proportional Weights
Weighted_SD = (current_SD * current_days +
prev1_SD * prev1_days +
prev2_SD * prev2_days +
prev3_SD * prev3_days) /
(current_days + prev1_days + prev2_days + prev3_days)
• Merges evolving volatility with the stability of three prior months.
• Weights each period by its trading days.
• Yields a robust normalization benchmark.
### 2.3 Blended SD: Current + 1 Past Period
This variant tempers emerging volatility by blending the current month with last month only.
pseudocode
// -- MULTI-PERIOD STANDARD DEVIATION (PROXY) with One Past Period --
current_days = BarsSince("start_of_month")
current_SD = STDDEV(Close, current_days)
prev1_days = TradingDaysLastMonth
prev1_SD = STDDEV_LastMonth(Close)
// Proportional Blend
Weighted_SD = (current_SD * current_days +
prev1_SD * prev1_days) /
(current_days + prev1_days)
• Anchors current volatility to last month’s baseline.
• Softens spikes by blending with historical data.
Conclusion
Segmented weighted-average volatility transforms global benchmarking by integrating immediate market dynamics with enduring historical context. This fixed-point approach—applicable to SD, MAD (scaled), and ATR (scaled)—delivers truly insightful, time-sensitive analysis.
發行說明
# PrismWAP (Anchored)Overview
PrismWAP plots three anchored weighted-average prices (VWAP, TWAP, TrueWAP) with dynamic volatility bands and a resettable anchor line. It helps you see key value levels since your chosen anchor period and gauge price excursions relative to volatility.
How It Works
On each new span (session, week, month, quarter, etc.), the indicator resets a base price from the first bar’s open. It computes anchored VWAP, TWAP, and TrueWAP cumulatively over the span. Volatility bands are drawn as ±multiplier × a span-length-weighted average of your chosen volatility measure (Std Dev, MAD, ATR-scaled, or Percent of WAP).
Inputs
Settings Description
Anchor Period Span for resetting WAP and anchor line (Week, Month, etc.)
Volatility Measure Method for band width: Std Dev, MAD, ATR (scaled), or Percent of WAP
Volatility Spans Number of spans (current + previous spans) used in weighted average volatility
Band Multiplier (or %) Multiplier for band width (or Percent of WAP in Percent mode)
Scale MAD to σ Scale MAD by √(π/2) so it aligns with σ under Normal distribution
Display
• Show Anchor Line
• Show VWAP
• Show TWAP
• Show TrueWAP
• Show VWAP Bands
• Show TWAP Bands
• Show TrueWAP Bands
Tips & Use Cases
• Use shorter spans (Session, Week) for sub-daily bar intervals.
• Use longer spans (Quarter, Year) for daily bar intervals.
References:
1. TrueWAP Description
2. SD, MAD, ATR (scaled) weighted average volatility
## 1. TrueWAP: Volatility-Weighted Price Averaging
What Is TrueWAP?
TrueWAP plugs actual price fluctuations into your average. Instead of only tracking time (TWAP) or volume (VWAP), it weights each bar’s TrueRange midpoint by its TrueRange—so when the market moves more, that bar counts more.
In short, it’s a *TrueRange-weighted TrueMid average* anchored at your start date.
TrueWAP (Anchored) Overview
• On the first bar, it uses the simple high-low midpoint for price and the bar’s high-low range for weighting.
• From the next bar onward, it computes TrueMid by averaging the TrueRange high (higher of prior close or current high) with the TrueRange low (lower of prior close or current low).
• Each TrueMid is weighted by its TrueRange and cumulatively summed from the anchor point.
Pseudocode
// TWAP Example for Comparison
current_days = BarsSince("start_of_period")
OHLC = (Open + High + Low + Close) / 4
TWAP = MA(OHLC, current_days)
// VWAP Example for Comparison
current_days = BarsSince("start_of_period")
HLC3 = (High + Low + Close) / 3
VWAP = Sum(HLC3 * Volume, current_days) / Sum(Volume, current_days)
// TrueWAP (Anchored)
current_days = BarsSince("start_of_period") // Count of bars since the period began
first_bar = (current_days == 0) // Boolean flag if current bar is 1st of period
hilo_mid = (High + Low) / 2
max_val = max(Close[-1], High)
min_val = min(Close[-1], Low)
true_mid = (max_val + min_val) / 2
// Use hilo_mid and (High - Low) for the first bar; otherwise, use true_mid and True Range
mid_val = IF(first_bar, hilo_mid, true_mid)
range_val = IF(first_bar, (High - Low), TrueRange)
TrueWAP = Sum(mid_val * range_val, current_days) / Sum(range_val, current_days)
Recap: Interpretation
• The first bar uses the simple high-low midpoint and range.
• Subsequent bars use TrueMid and TrueRange based on prior close.
• This ensures the average reflects only the observed volatility and price since the anchor.
A Note on True Range
TrueRange captures the full extent of bar-to-bar volatility as the maximum of:
• High – Low
• |High – Previous Close|
• |Low – Previous Close|
## 2. Segmented Weighted-Average Volatility: A Fixed-Point Multi-Period Approach
### Introduction
Conventional standard deviation calculations aggregate data over an expanding window and rely on a single mean, producing one summary statistic. This can obscure segmented, sequential datasets—such as MTD, QTD, and YTD—where additional granularity and time-sensitive insights matter.
This methodology isolates standard deviation within defined time frames and then proportionally allocates them based on custom lookback criteria. The result is a dynamic, multi-period normalization benchmark that captures both emerging volatility and historical stability.
Note: While this example uses SD, the same fixed-point approach applies to MAD and ATR (scaled).
### 2.1 Standard Deviation (Rolling Window)
pseudocode
// -- STANDARD DEVIATION (ROLLING) Calculation --
window_size = 20
rolling_SD = STDDEV(Close, window_size)
• Ideal for immediate trading insights.
• Reflects pure, short-term price dynamics.
• Captures volatility using the most recent 20 trading days.
### 2.2 Blended SD: Current + 3 Past Periods
This method fuses current month data with the last three complete months.
pseudocode
// -- MULTI-PERIOD STANDARD DEVIATION (PROXY) with Three Past Periods --
current_days = BarsSince("start_of_month")
current_SD = STDDEV(Close, current_days)
prev1_days = TradingDaysLastMonth
prev1_SD = STDDEV_LastMonth(Close)
prev2_days = TradingDaysTwoMonthsAgo
prev2_SD = STDDEV_TwoMonthsAgo(Close)
prev3_days = TradingDaysThreeMonthsAgo
prev3_SD = STDDEV_ThreeMonthsAgo(Close)
// Blending with Proportional Weights
Weighted_SD = (current_SD * current_days +
prev1_SD * prev1_days +
prev2_SD * prev2_days +
prev3_SD * prev3_days) /
(current_days + prev1_days + prev2_days + prev3_days)
• Merges evolving volatility with the stability of three prior months.
• Weights each period by its trading days.
• Yields a robust normalization benchmark.
### 2.3 Blended SD: Current + 1 Past Period
This variant tempers emerging volatility by blending the current month with last month only.
pseudocode
// -- MULTI-PERIOD STANDARD DEVIATION (PROXY) with One Past Period --
current_days = BarsSince("start_of_month")
current_SD = STDDEV(Close, current_days)
prev1_days = TradingDaysLastMonth
prev1_SD = STDDEV_LastMonth(Close)
// Proportional Blend
Weighted_SD = (current_SD * current_days +
prev1_SD * prev1_days) /
(current_days + prev1_days)
• Anchors current volatility to last month’s baseline.
• Softens spikes by blending with historical data.
Conclusion
Segmented weighted-average volatility transforms global benchmarking by integrating immediate market dynamics with enduring historical context. This fixed-point approach—applicable to SD, MAD (scaled), and ATR (scaled)—delivers truly insightful, time-sensitive analysis.
受保護腳本
此腳本以閉源形式發佈。 不過,您可以自由使用,沒有任何限制 — 點擊此處了解更多。
免責聲明
這些資訊和出版物並非旨在提供,也不構成TradingView提供或認可的任何形式的財務、投資、交易或其他類型的建議或推薦。請閱讀使用條款以了解更多資訊。
受保護腳本
此腳本以閉源形式發佈。 不過,您可以自由使用,沒有任何限制 — 點擊此處了解更多。
免責聲明
這些資訊和出版物並非旨在提供,也不構成TradingView提供或認可的任何形式的財務、投資、交易或其他類型的建議或推薦。請閱讀使用條款以了解更多資訊。