OPEN-SOURCE SCRIPT
已更新 High/Low mura vision
Description
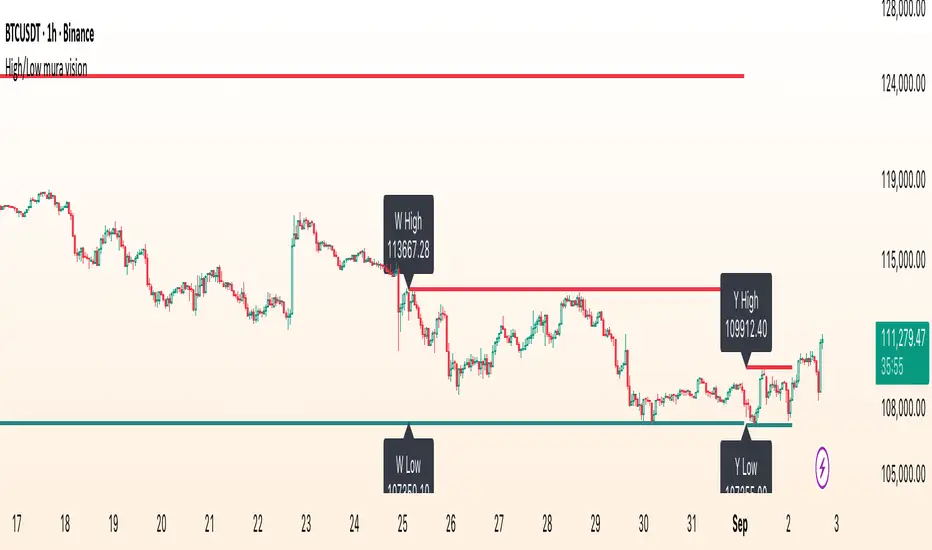
High/Low mura vision plots static support and resistance lines based on the completed high and low values of the prior trading day, week and calendar month.
This script:
How It Works
Key Features
How to Use
Inputs
Disclaimer
This script is provided “as‐is” under the Public License. It is intended for educational and analytical purposes only and does not constitute trading or investment advice. Past performance does not guarantee future results. Always perform your own analysis and manage risk responsibly.
High/Low mura vision plots static support and resistance lines based on the completed high and low values of the prior trading day, week and calendar month.
This script:
- Anchors each level to the exact start and end bars of the completed period
- Does not repaint or extend levels into the current period
- Uses request.security() to retrieve only historical data (no lookahead)
- This indicator was built to give traders clear, unambiguous reference points for breakout entries, pullback targets or confirmation of supply/demand zones without guessing where to draw manually.
How It Works
- At the close of each daily candle, the script captures high[1] and low[1] via request.security() and draws flat lines spanning only that day’s bars.
- Similarly, at the close of Friday’s weekly candle and the last bar of each calendar month, it draws the completed week’s and month’s high/low ranges.
- All lines are deleted and redrawn only once per period completion, ensuring no forward painting or hidden repainting logic.
Key Features
- No repaint: levels appear exactly once, immediately after the period closes
- Period‑specific: lines confined to the bars of the prior day, week or month
- Customizable: toggle each period on/off; choose independent colors, line styles (Solid, Dotted, Dashed) and width
- Lightweight: minimal calculations for maximum performance on any timeframe
How to Use
- Apply to any chart (M1 to MN).
- In the Inputs panel, enable the levels you need: Yesterday, Last Week or Last Month.
- Adjust High and Low line color, style and thickness to suit your chart layout.
- Use these historic levels for support/resistance, breakout confirmation or confluence with other tools.
Inputs
- Show Yesterday’s High: toggle yesterday’s high line
- Show Yesterday’s Low: toggle yesterday’s low line
- Show Last Week’s High: toggle last week’s high line
- Show Last Week’s Low: toggle last week’s low line
- Show Last Month’s High: toggle last month’s high line
- Show Last Month’s Low: toggle last month’s low line
- High Line Color / Low Line Color: choose colors for each set of lines
- High Line Style / Low Line Style: select Solid, Dotted or Dashed
- Line Width: adjust overall thickness
Disclaimer
This script is provided “as‐is” under the Public License. It is intended for educational and analytical purposes only and does not constitute trading or investment advice. Past performance does not guarantee future results. Always perform your own analysis and manage risk responsibly.
發行說明
Made some minor changes開源腳本
秉持TradingView一貫精神,這個腳本的創作者將其設為開源,以便交易者檢視並驗證其功能。向作者致敬!您可以免費使用此腳本,但請注意,重新發佈代碼需遵守我們的社群規範。
✅My Telegram
t.me/trading_mura
t.me/trading_mura
免責聲明
這些資訊和出版物並非旨在提供,也不構成TradingView提供或認可的任何形式的財務、投資、交易或其他類型的建議或推薦。請閱讀使用條款以了解更多資訊。
開源腳本
秉持TradingView一貫精神,這個腳本的創作者將其設為開源,以便交易者檢視並驗證其功能。向作者致敬!您可以免費使用此腳本,但請注意,重新發佈代碼需遵守我們的社群規範。
✅My Telegram
t.me/trading_mura
t.me/trading_mura
免責聲明
這些資訊和出版物並非旨在提供,也不構成TradingView提供或認可的任何形式的財務、投資、交易或其他類型的建議或推薦。請閱讀使用條款以了解更多資訊。