OPEN-SOURCE SCRIPT
Volume Delta & Divergence (VDD) by CoryP1990 – Quant Toolkit
Volume Delta & Divergence (VDD) visualizes directional order flow by tracking session-aware Cumulative Volume Delta (CVD) and highlighting structural mismatches between price pivots and CVD. It’s designed to catch persistent buying/selling pressure and to flag divergences where price moves without supporting order flow.
How it works
Per-bar delta: classify ticks as uptick or downtick using price change inside each bar; compute delta = uptickVol − downtickVol.
Cumulative Delta (CVD): sum delta across the session (optional continuous mode available).
Smooth: apply an EMA to the CVD (CVD-EMA) to reduce noise and reveal structural shifts.
Divergence detection: detect price pivots (left/right = X bars); sample the CVD-EMA at the exact pivot bars and compare the last two price pivots vs the corresponding CVD-EMA values.
Bear divergence: price makes a higher high while CVD-EMA makes a lower high → fading buy pressure at the top.
Bull divergence: price makes a lower low while CVD-EMA makes a higher low → improving buying pressure into the lows.
Markers: non-repainting pivot confirmation requirement (markers appear only after pivots are confirmed) and markers are placed on the actual pivot bar for clarity.
Visuals / legend
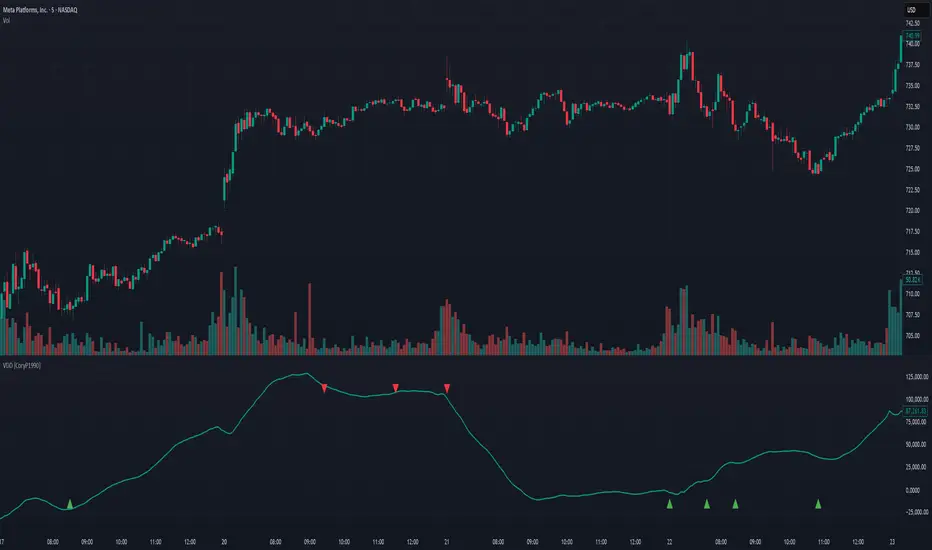
Teal line: CVD-EMA (smoothed cumulative delta). Rising → net buying pressure; falling → net selling pressure.
Red triangle (above): Bear divergence - price HH vs CVD LH.
Green triangle (below): Bull divergence - price LL vs CVD HL.
No background tint - VDD is a structural order flow tool (markers + CVD line only). Use the VWMA / trend overlays to provide directional context.
Use cases
Detect hidden exhaustion at highs (fade setups) and hidden accumulation at lows (bounce setups).
Confirm or invalidate momentum moves: price rising but CVD falling warns the move lacks order flow support.
Spot campaign-style pressure across a session (session reset) versus multi-day campaigns (disable reset).
Combine with VWMA(50) or higher-TF alignment to filter signals and increase quality.
Defaults
CVD EMA length = 34
Pivot left/right = 5
Reset CVD at session start = ON (recommended for intraday)
Show raw CVD = OFF
Marker size = small (use normal for screenshots)
Example — META (5m, 5-day view)
The 5-day time range 5-minute interval on META shows the pattern VDD is built for: a midday bear divergence (price ticks to a marginal high while the CVD-EMA flattens and then rolls lower) that precedes a multi-hour drift lower, and later bull divergences near intraday lows where the CVD-EMA prints higher lows as price prints lower lows, followed by constructive bounces. With resetSession=ON you can see these flows replay across sessions and judge whether a divergence is isolated or repeated (higher-quality).
Practical tips
Default demo: 5-minute chart on liquid names (META, AAPL, SPY) - lenEMA=34, pivot=5, resetSession=ON.
Scalp: 1m with shorter EMA (e.g., 13) and pivot=3.
Swing / campaign: 4H/Daily with resetSession=OFF and longer EMA (e.g., 89).
Filter with VWMA(50) and require above-average volume at the pivot region for higher-probability signals.
Use alerts (script exposes bear/bull alertconditions) to monitor divergences in real time.
Limitations / disclaimers
Markers are confirmation-based (non-repainting), i.e. they appear after the pivot completes, not as a predictive tick.
No single divergence equals a trade; combine with trend, volume, and risk management.
Part of the Quant Toolkit — transparent, open-source indicators for modern quantitative analysis. Built by CoryP1990.
How it works
Per-bar delta: classify ticks as uptick or downtick using price change inside each bar; compute delta = uptickVol − downtickVol.
Cumulative Delta (CVD): sum delta across the session (optional continuous mode available).
Smooth: apply an EMA to the CVD (CVD-EMA) to reduce noise and reveal structural shifts.
Divergence detection: detect price pivots (left/right = X bars); sample the CVD-EMA at the exact pivot bars and compare the last two price pivots vs the corresponding CVD-EMA values.
Bear divergence: price makes a higher high while CVD-EMA makes a lower high → fading buy pressure at the top.
Bull divergence: price makes a lower low while CVD-EMA makes a higher low → improving buying pressure into the lows.
Markers: non-repainting pivot confirmation requirement (markers appear only after pivots are confirmed) and markers are placed on the actual pivot bar for clarity.
Visuals / legend
Teal line: CVD-EMA (smoothed cumulative delta). Rising → net buying pressure; falling → net selling pressure.
Red triangle (above): Bear divergence - price HH vs CVD LH.
Green triangle (below): Bull divergence - price LL vs CVD HL.
No background tint - VDD is a structural order flow tool (markers + CVD line only). Use the VWMA / trend overlays to provide directional context.
Use cases
Detect hidden exhaustion at highs (fade setups) and hidden accumulation at lows (bounce setups).
Confirm or invalidate momentum moves: price rising but CVD falling warns the move lacks order flow support.
Spot campaign-style pressure across a session (session reset) versus multi-day campaigns (disable reset).
Combine with VWMA(50) or higher-TF alignment to filter signals and increase quality.
Defaults
CVD EMA length = 34
Pivot left/right = 5
Reset CVD at session start = ON (recommended for intraday)
Show raw CVD = OFF
Marker size = small (use normal for screenshots)
Example — META (5m, 5-day view)
The 5-day time range 5-minute interval on META shows the pattern VDD is built for: a midday bear divergence (price ticks to a marginal high while the CVD-EMA flattens and then rolls lower) that precedes a multi-hour drift lower, and later bull divergences near intraday lows where the CVD-EMA prints higher lows as price prints lower lows, followed by constructive bounces. With resetSession=ON you can see these flows replay across sessions and judge whether a divergence is isolated or repeated (higher-quality).
Practical tips
Default demo: 5-minute chart on liquid names (META, AAPL, SPY) - lenEMA=34, pivot=5, resetSession=ON.
Scalp: 1m with shorter EMA (e.g., 13) and pivot=3.
Swing / campaign: 4H/Daily with resetSession=OFF and longer EMA (e.g., 89).
Filter with VWMA(50) and require above-average volume at the pivot region for higher-probability signals.
Use alerts (script exposes bear/bull alertconditions) to monitor divergences in real time.
Limitations / disclaimers
Markers are confirmation-based (non-repainting), i.e. they appear after the pivot completes, not as a predictive tick.
No single divergence equals a trade; combine with trend, volume, and risk management.
Part of the Quant Toolkit — transparent, open-source indicators for modern quantitative analysis. Built by CoryP1990.
開源腳本
本著TradingView的真正精神,此腳本的創建者將其開源,以便交易者可以查看和驗證其功能。向作者致敬!雖然您可以免費使用它,但請記住,重新發佈程式碼必須遵守我們的網站規則。
Quant finance researcher focused on options, volatility modeling, and derivative pricing. Building tools that turn complex market behavior into clear, data-driven insights. Explore analytics and modeling at OptionsAnalysisSuite.com
免責聲明
這些資訊和出版物並不意味著也不構成TradingView提供或認可的金融、投資、交易或其他類型的意見或建議。請在使用條款閱讀更多資訊。