INVITE-ONLY SCRIPT
TDR (Trend Direction & Risk) Indicator
已更新
Introduction
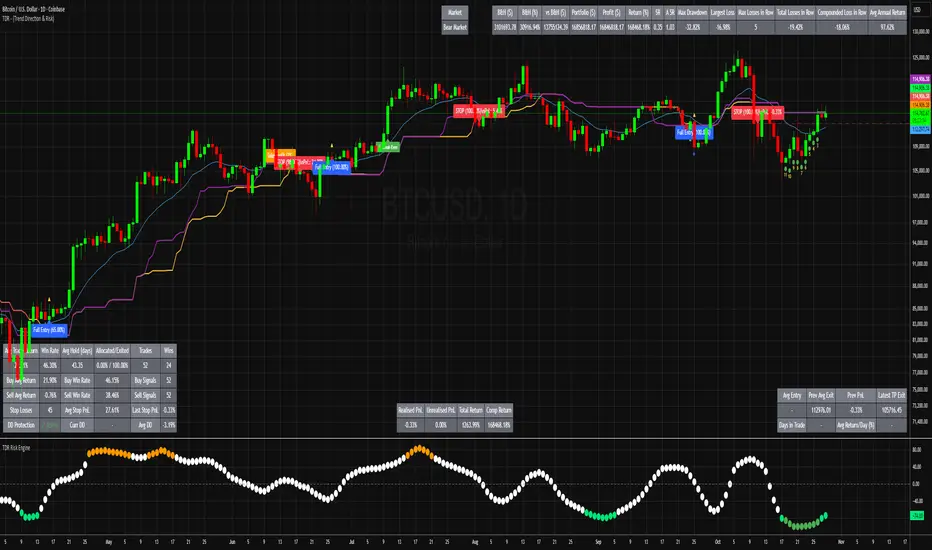
The TDR (Trend Direction & Risk) Indicator combines two of my previous indicators into one. TDR helps to visually identify price trends and also measures the risk of entering a position during that trend. This indicator is a combination of Ichimoku cloud techniques, particularly the Kijun-Sen and the percentage price oscillator (PPO) to measure a risk score.
Using the TDR Indicator
There are two main indicator lines, the blue line represents a moving average which can act as support or resistance and the orange and red line is called the trend base. When price crosses the trend base and the moving average also crosses then a change in trend direction is confirmed. This is confirmed with either a Buy or Sell signal.
In between these signals there are also Dollar Cost Average and Take Profit signals based on the current trend direction. Each of these signals gives a warning, indicated with an x above or below the candle accompanied with a b for (buy) or an (s) for sell. The next candle will display a small triangle as confirmation of this signal. These signals are based on a cross of the Advance Signal Price which is show at the current price candle.
The future base level can be set to show a larger macro trend than the current timeframe. An example of this is the 3 day timeframe which I use to determine if Bitcoin is in either a bull or bear market.
The Dollar Cost Average and Take Profit signals recommend to buy or remove a percentage of your position at these points. This percentage is completely down to personal preference.
Risk & Information Box
At the bottom right of the chart there is an information box which contains some Information. It shows the current recommended position based on the signals mentioned above. It also shows a risk score which ranges from -100 to 100. This can be used in combination with the signals and trend above for additional entry points. There are three levels, Low, Neutral and High. Buying a percentage of a position at a low risk level and selling a percentage of a position at a high risk level in combination with the trend signals is recommended.
S/R and Base Percentage
These boxes show the price percentage distance from the blue S/R line and the Trend Base Line. These larger these percentages the more likely a snap back in price towards these lines is likely. In my testing once these get above 20% or -20% the chance the price will move back towards those lines is more likely.
Users who have access to my other scripts will be given access to this one and those old ones will no longer me maintained or updated.
發行說明
Adds a new field to the table which shows the current market condition, bull or bear market. This is calculated based on the High Timeframe Market Trend which can be changed in the settings, Default is 3Day and recommended to keep it on 3Day.發行說明
Changed the descriptions for active position.發行說明
Add an option to hide the Data Table on the bottom right of the chart. Show active positions as either IN or OUT發行說明
Added a visual representation of the risk on the chart. When the risk level is very high it will show as a red circle above the candles and when very low a green circle below the candles.發行說明
Remove most of the data from the table that is shown visually on the chart now. Show only Bull or Bear Market text instead.發行說明
Added ATR indicator on current bar and added ability to set the risk zone value僅限邀請腳本
僅限作者授權的用戶訪問此腳本,並且通常需要付費。您可以將其增加到收藏腳本中,但是只有在向作者請求並獲得許可之後,才能使用它。 請聯繫Cryptodontrading以了解更多信息,或按照下面作者的說明進行操作。
TradingView 不建議購買並使用此腳本,除非您 100% 信任其作者並了解腳本的工作原理。在許多情況下,您可以在我們的社群腳本中免費找到良好的開源替代方案。
作者的說明
″This is a paid for Indicator. The learn how to get access please send me a private message and I will get back to you.
想在圖表上使用此腳本?
警告:請閱讀,然後再請求訪問權限。
免責聲明
這些資訊和出版物並不意味著也不構成TradingView提供或認可的金融、投資、交易或其他類型的意見或建議。請在使用條款閱讀更多資訊。