OPEN-SOURCE SCRIPT
Day of Week Performance
█ OVERVIEW
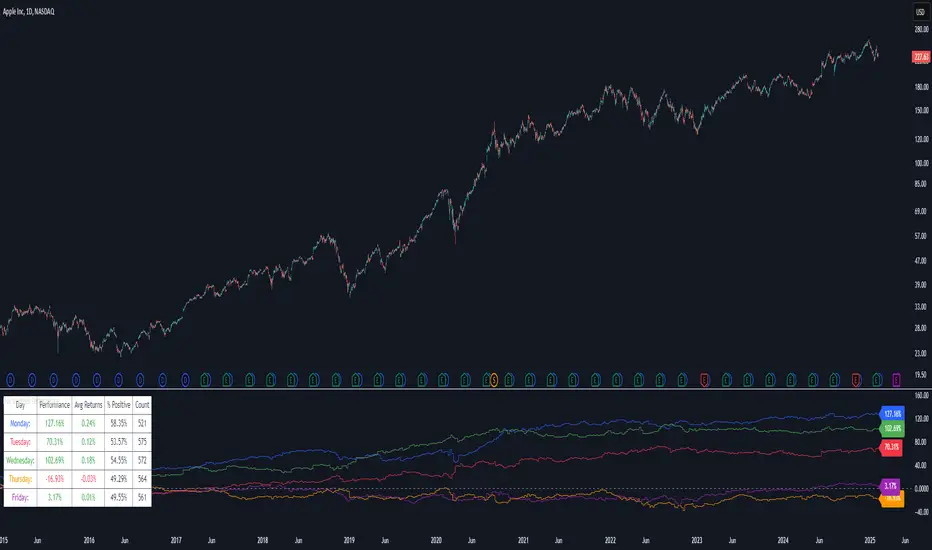
The Day of Week Performance indicator is designed to visualise and compare the cumulative percentage change for each day of the week. This indicator explores one of the many calendar based anomalies in financial markets.
In financial analysis, a calendar based anomaly refers to recurring patterns or tendencies associated with specific time periods, such as days of the week. By calculating the cumulative percentage change for each day (Monday through Friday) and displaying the results both graphically and in a summary table, this indicator helps identify whether certain days consistently outperform others.
█ FEATURES
█ HOW TO USE
Colour Scheme:
The Day of Week Performance indicator is designed to visualise and compare the cumulative percentage change for each day of the week. This indicator explores one of the many calendar based anomalies in financial markets.
In financial analysis, a calendar based anomaly refers to recurring patterns or tendencies associated with specific time periods, such as days of the week. By calculating the cumulative percentage change for each day (Monday through Friday) and displaying the results both graphically and in a summary table, this indicator helps identify whether certain days consistently outperform others.
█ FEATURES
- Customisable time window via Time Settings.
- Calculates cumulative percentage change for each day (Monday to Friday) separately.
- Option to use Sunday instead of Friday for CFDs and Futures analysis.
- Distinct visual representation for each day using unique colours.
- Customisable table settings including position and font size.
- Built-in error checks to ensure the indicator is applied on a Daily timeframe.
█ HOW TO USE
- Add the indicator to a chart set to a Daily timeframe.
- Select your desired Start Time and End Time in the Time Settings.
- Toggle the performance table on or off in the Table Settings.
- Adjust the table’s location and font size as needed.
- Use the "Use Sunday instead of Friday" option if your market requires it.
- View the cumulative performance plotted in distinct colours.
Colour Scheme:
- Monday: Blue
- Tuesday: Red
- Wednesday: Green
- Thursday: Orange
- Friday: Purple
開源腳本
秉持TradingView一貫精神,這個腳本的創作者將其設為開源,以便交易者檢視並驗證其功能。向作者致敬!您可以免費使用此腳本,但請注意,重新發佈代碼需遵守我們的社群規範。
免責聲明
這些資訊和出版物並非旨在提供,也不構成TradingView提供或認可的任何形式的財務、投資、交易或其他類型的建議或推薦。請閱讀使用條款以了解更多資訊。
免責聲明
這些資訊和出版物並非旨在提供,也不構成TradingView提供或認可的任何形式的財務、投資、交易或其他類型的建議或推薦。請閱讀使用條款以了解更多資訊。